


Index
Macro Update
by Dean Orrico, President & CEO and Robert Lauzon, Managing Director & CIO
Equity markets fell for a third straight month in October with the TSX Composite, MSCI World and S&P 500 Indices generating total returns of -3.2%, -2.9% and -2.1%, respectively. U.S. 10-year treasury yields continued to rise, finishing the month at 4.93% and briefly exceeding 5%. Elsewhere, bond yields were relatively flat with the Canadian 10-year finishing just above 4%.
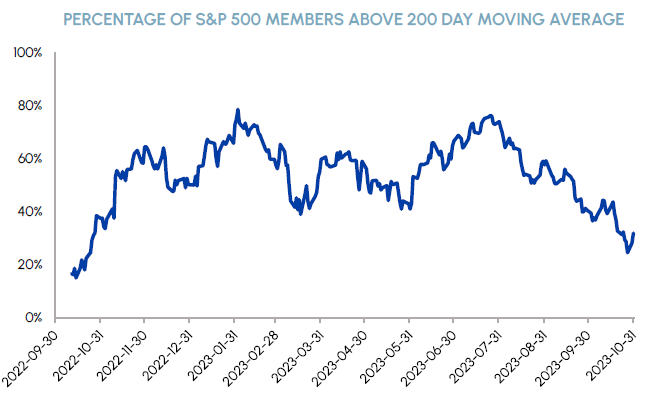
Despite recent volatility, the S&P 500 has still generated a total return of 10.7% year-to-date. On the surface, this may seem like a year of strong returns for the market, but most stocks have not participated in the upside. At the end of October, only 32% of S&P 500 constituents were trading above their 200-day moving averages, levels not seen since October 2022 when the market bottomed. Rate sensitive sectors such as Utilities and Real Estate have been particularly weak, with fewer than 10% of their S&P constituents trading above their 200-day moving averages. Amidst these conditions, we remain focused on companies that will continue to generate high levels of free cash flow through a period of higher interest rates.
|
|
Green shoots emerged at the Federal Reserve’s meeting on November 1st. The Fed kept interest rates unchanged for a second consecutive meeting and Fed Chair Jerome Powell conveyed a more dovish tone in his press conference. Powell signaled that risks are now balanced between hiking too little (previous concern) versus hiking too much and acknowledged that it takes time for higher rates to flow through the system. US 10-Year yields declined in response to these comments, spurring a broad-based relief rally in the stock market. We believe the hiking cycle is likely over, and the market will start looking forward to rate cuts in the second half of 2024. If the Fed cuts rates next year due to disinflation, rather than an economic slowdown, pockets of the market that have lagged this year should stage a sustained recovery.
Tensions in the Middle East introduce a new risk that could derail the progress from central banks. Rising oil prices have been a notable symptom of past wars and are particularly relevant today as central banks attempt to lower inflation. In addition, a drawn-out conflict would exacerbate fears of increased funding needs from the U.S. government which has been a key focus for bond investors recently. We are closely watching for signs of escalation from other countries but are hopeful that diplomatic efforts will be successful in lowering the temperature of an increasingly volatile situation.
With yields starting to come down in early November, we believe the pieces are in place for a Santa Clause rally to finish the year. 37% of U.S. mutual funds have a September or October year end, suggesting a significant phase of tax-loss selling is behind us. Moreover, corporate buybacks should start to accelerate with 70% of S&P companies now in open buyback windows after reporting Q3 earnings. Bearish sentiment is also at a 2023 high (per the AAII investor survey) which has traditionally been a useful contrarian indicator. Barring a major escalation in the Middle East, November and December could be excellent months for the market and rate-sensitive sectors in particular.
Real Estate
Middlefield Fund Tickers & Codes: MREL / MID 600 / RS / RS.PR.A / RA.UN / MSRE.UN
by Dean Orrico, President & CEO
The TSX real estate sector declined by 6% this month. Capitulatory selling conditions were evident across the sector as the market grapples with higher bond yields and tax loss selling season. We continue to believe current valuations represent deeply oversold conditions which offer an attractive entry point for long-term investors.
Supporting our view is a Canadian real estate industry which is well-positioned to handle higher interest rates for a long period of time. On average, approximately 90% of the debt for Canadian publicly listed REITs is subject to fixed interest rates with an average rate of 3.9%. The weighted-average term to maturity for REIT debt is 4.3 years with less than 20% of total debt coming due before the end of 2024. In addition, the sector’s liquidity ratio is 13% and is above the long-term average of 11%. With an average 2024 AFFO payout ratio of 75%, we believe most REITs can adequately fund dividends with the potential for dividend bumps in many cases. We have been advocating for dividend increases in our recent discussions with management teams as we believe they would signal to investors that higher rates are manageable.
Given the laddered structure of debt maturities, the impact of higher rates on earnings will occur over an extended period. The ability to generate strong organic growth in net operating income (NOI) will be key to offsetting higher interest expenses as debt is refinanced. Multi-family residential, industrial, seniors housing and select retail REITs remain the best positioned to deliver above-average NOI growth. We will be looking for signs of sustained increases in NOI from companies as they report Q3 earnings over the first two weeks of November. InterRent REIT, a portfolio holding that was among the first to report, delivered an encouraging start to earnings season with year-over-year same property NOI growth of 10.5% and a dividend increase of 5%.
Healthcare
Middlefield Fund Tickers & Codes: MHCD / MID 325 / SIH.UN
by Robert Moffat, Portfolio Manager
The healthcare sector returned -3.2% in October, underperforming the S&P 500 for the first time since July. MedTech stocks weighed on performance once again while defensive pockets of the sector such as Managed Care outperformed.
The healthcare equipment sub-industry returned -5.4% in October, presenting an attractive buying opportunity in quality names that are oversold. As we wrote about last month, sentiment in MedTech stocks is being impacted by GLP-1 agonists such as Novo Nordisk’s Ozempic and Eli Lilly’s Mounjaro. MedTech companies that have reported Q3 earnings thus far have reinforced our view that the recent selloff is overdone and these fears are overblown. Boston Scientific (BSX), a core holding we have been adding to recently, delivered upside across its major business lines, causing the company to raise its full-year EPS guidance. Sales in BSX’s cardiovascular division were up 10.2% year over year compared to expectations of 8%. Dexcom, another portfolio holding which is at the centre of the GLP-1 debate, delivered a strong beat-and-raise quarter which was driven by record new patient starts on its CGM devices. Dexcom’s stock price was up >10% on the earnings report but is still more than 35% below its 52-week high, implying further upside is embedded in the stock.
Managed Care Organizations (MCOs) offer safe-haven qualities that are highly coveted by investors amidst market uncertainty. The group has underperformed throughout the year but finally bounced in October with a weighted-average return of 5.5%. We have been underweight MCOs on concerns of rising expenses from increased hospital utilization. This decision has been a positive contributor to performance this year. Recently, we have become more constructive on the group due to their consistent recurring revenues and stable earnings from the premiums paid by their growing pool of beneficiaries. UnitedHealth Group and Humana are our preferred names in the space. Both companies beat earnings expectations with their Q3 results, driven by lower-than-expected Medical Loss Ratios (expenses).

Sustainable Infrastructure
Middlefield Fund Tickers & Codes: MINF / CLP.UN / MID 265 / MID 510 / ENS / ENS.PR.A
by Robert Lauzon, Managing Director & CIO
Despite recent challenges facing the clean power industry, now is not the time to abandon this secular growth theme. We believe the entire space is oversold and should recover nicely through year-end 2024, especially considering the improving outlook for global monetary policy.
Macro headwinds have weighed on stock prices, pushing them down far below fair values. These will likely subside going forward as inflation continues to normalize. Another important development we are witnessing is “rationalization”. Companies are abandoning uneconomic projects, and we believe this is a good thing for the industry. Savvy operators will need to take a measured approach going forward. Companies that do not will get flushed out, thereby allowing the best companies to emerge stronger in years to come.
Finally, we would note that demand for renewable power remains strong, supported by governments and corporates alike. This is especially true given that the world’s biggest companies (e.g. Apple, Microsoft, etc.) are fully committed to their net zero targets.
Given the above backdrop, we are equally concerned about portfolio positioning. We are generally avoiding companies with business models that are 1) tied to financing costs (i.e. become less attractive as rates rise) and 2) reliant on external funding (i.e. where internal cash flow generation is not enough to fund capex, dividends and buybacks).
In Utilities, we are favoring stable networks over developers and are looking for companies with low leverage, low complexity and fair valuations. Within Industrials & Technology, we are sticking with diversified companies that provide exposure to megatrends such as electrification and onshoring/nearshoring. We are also continuing to maintain a preference for utility-scale vs residential solar.
Technology & Communications
Middlefield Fund Tickers & Codes: MINN / SIH.UN / MID 925
by Shane Obata, Portfolio Manager
The Q3 reporting season has felt mixed, with earnings beats mildly rewarded and misses punished. Even so, the actual results have been quite good. Thus far, 57% of Tech companies beat on revenues while a much more impressive 84% beat on earnings. More importantly, sales and net income growth are above-market for the sector as a whole.
As we look forward, there are several important inflection points happening. Intel and AMD alluded that the PC market is recovering while Samsung was optimistic on smartphones and memory. As these two critical markets improve, we think 2024 earnings estimates will continue to be revised higher. This has been the trend since the end of Q1, with Nasdaq 100 EPS estimates rising ~8.7% for 2023 and nearly ~9.6% for 2024.
 |
While Google’s cloud results were underwhelming, Microsoft and Amazon fared much better. Overall, we believe the cloud market is healthy, which bodes well for the software industry in general and also for the semiconductor companies supporting it.
Artificial intelligence remains top of mind and we continue to see tangible benefits for early beneficiaries. Nvidia and Microsoft’s successes are well known but we are also seeing momentum for Advanced Micro Devices and for networking companies such as Arista Networks.
While 2023 has been especially kind to Tech investors, we remain optimistic that solid fundamentals will continue to support the sector in 2024. Recent estimates show that expectations are for the S&P 500 to grow EPS by 11% next year. For the Tech sector, that number is expected to reach 16%.

Resources
Middlefield Fund Tickers & Codes: MID 800 / MID 161 / ENS / ENS.PR.A / MID 265
by Dennis da Silva, Senior Portfolio Manager
Spot gold broke through the technical level of US$2,000/oz as it confirms its status as a haven asset during geopolitical unrest. We have a positive outlook on gold prices as rate cuts are forcasted in 2024. The US Fed rate cycle has historically been a significant factor driving the price of gold. Over the past 40 years, gold has increased an average of 34% during periods of central bank easing compared to an average return of 6% during periods of tightening. The S&P/TSX Global Gold Index was up 6.4% in October, significantly outperforming broad equity indexes but slightly behind bullion’s 7.3% rise.
A sharp escalation in geopolitical risk in the Middle East, a region accounting for more than one-third of the world’s seaborne oil trade, has created uncertainty for oil markets. The initial risk premium following the events of October 7th has gradually disappeared with the price of oil closing out October slightly below where it was before the attacks. While there has been no direct impact on physical supply, markets will remain anxious as the crisis unfolds. We expect significant upside to near term oil prices if the Israel-Hamas war escalates into a wider spread regional conflict. As we have discussed previously, physical crude markets are tight thanks to OPEC+ and US producer spending discipline. While we remain focused on the fundamentals of the oil market, we acknowledge that momentum can play a significant factor in commodity markets.
Blockbuster takeovers by US oil and gas majors Exxon and Chevron during October may spark more multibillion megadeals in the energy complex. Chevron agreed to buy Hess for US$53 billion in stock, less than two weeks after Exxon secured a deal to buy rival Pioneer Natural Resources in a transaction valued at $59.5 billion. While this marks Exxon’s largest deal since its acquisition of Mobil, the merger would also double the oil giant’s production volume in the largest U.S. oilfield, the Permian Basin.
We believe investors seeking stable and growing dividend income within energy infrastructure should look no further than Topaz Energy. Topaz is a unique hybrid that offers investors more stable cash flows than a production company given its midstream ownership, but also free cash flow growth given its commodity exposure through royalties on some of the best resource plays in Canada. Given the structural demand shift coming to North American natural gas in the next 12-24 months, Topaz is poised to benefit being 70% natural gas weighted by royalty production, primarily through the superior growth profile of Canada’s largest natural gas producer Tourmaline Oil.
ESG: Environmental, Social & Governance
Middlefield Fund Tickers & Codes: MDIV / MINF / CLP.UN / SIH.UN / MSRE.UN / MID 265
by Stephen Erlichman, Chair, ESG (Environmental, Social and Governance)
On October 26, Canada’s Responsible Investment Association (“RIA”) published its 2023 Canadian Responsible Investment Trends Report (the “Report”). The Report is based on responses to a voluntary survey that were received from asset managers and asset owners together with public information from additional entities. Accordingly, the Report is not comprehensive, but it does provide a baseline to measure the growth and development of the responsible investment (“RI”) industry and RI practices in Canada, using financial data as of December 31, 2022.
The Report notes that it defines RI as the incorporation of ESG factors into the selection and management of investments. The following are some of the interesting findings set out in the Report.
1. RI’s market share as a percentage of all Canadian professionally managed assets increased from 47% in 2021 to 49% in 2022, even though reported Canadian RI assets under management deceased slightly from $3 trillion in 2021 to $2.9 trillion in 2022.
2. The top 3 reasons why investors considered ESG factors in their investment decisions were: to minimize risk; to improve returns; to fulfill fiduciary duty.
3. The top 3 ESG issues that were systematically incorporated into investment decisions were: GHG emissions; board diversity & inclusion; climate change mitigation. The Report noted that among the top ESG factors, there is a relatively balanced spread of E, S and G factors.
4. In their investment strategies: 94% of organizations use ESG integration; 82% use corporate engagement; 80% use negative screening.
5. In regard to RI polices and practices: 91% of organizations have a RI policy statement, with 82% of such policies publicly disclosed; 78% of organizations have guidelines for RI proxy voting, with 82% of such guidelines publicly disclosed; 73% of organizations have a shareholder engagement policy, with 81% of those policies publicly disclosed; 61% of organizations have an ESG integration program, with 68% of such programs publicly disclosed.
6. The leading sources of ESG information that organizations rely on are: direct engagement with companies (67%); companies’ sustainability/integrated reports (62%); external ESG research provider (62%); in-house research (60%). Interestingly, only 3% of respondents identified the media as a source of ESG information, with some respondents indicating that the media was a source of misinformation.
7. The respondents’ growth expectations for RI over the coming two years were: 25% high growth (compared to 38% high growth expected in last year’s survey); 50% moderate growth (compared to 51% moderate growth expected in last year’s survey); 18% low growth (compared to 7% low growth expected in last year’s survey).
8. The respondents’ views on what they considered the most important deterrents to growth in RI in Canada were: mistrust/concerns about greenwashing (64%); lack of standardized ESG disclosure frameworks/standards (57%); lack of reliable data (51%).
In summary, the Report notes that “Investors’ expectations for future RI growth have moderated with concerns about greenwashing, disclosures and data quality persisting as the top deterrents to growth. How we address these challenges, through the adoption of emerging global standards and clear regulatory guidance, will determine RI’s potential to rise to the greatest challenges of our times”.

Exchange Traded Funds (ETFs)
Mutual Funds (FE | F)
TSX-Listed Closed-End Funds
| Fund | Ticker | Strategy |
|---|---|---|
| MINT Income Fund | MID.UN | Equity Income |
| Sustainable Real Estate Dividend Fund | MSRE.UN | Sustainable Real Estate |
| International Clean Power Dividend Fund | CLP.UN | Sustainable Power |
| Middlefield Global Real Asset | RA.UN | Real Assets |
| Sustainable Innovation & Health Dividend Fund | SIH.UN | Innovation & Healthcare |
TSX-Listed Split Share Corps. (Class A | Preferred)
| Fund | Ticker | Strategy |
|---|---|---|
| E-Split Corp. | ENS | ENS.PR.A | Energy Infrastructure |
| Real Estate Split Corp. | RS | RS.PR.A | Real Estate |
LSE-Listed Investment Fund
| Fund | Ticker | Strategy |
|---|---|---|
| Middlefield Canadian Income Trust | MCT | Canadian Equity Income |