


Index
Macro Update
by Dean Orrico, President & CEO and Robert Lauzon, Managing Director & CIO
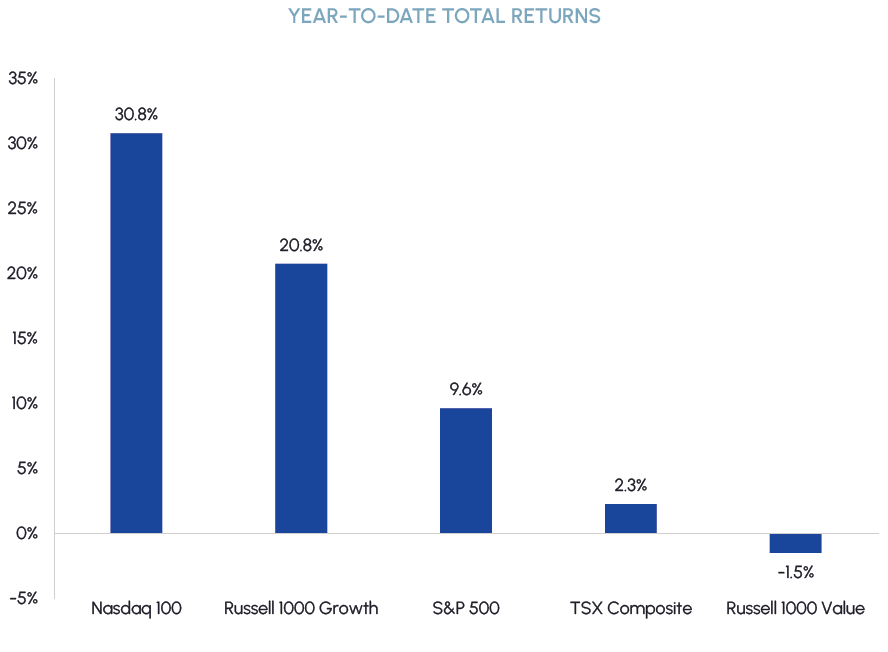
Despite outstanding performance from a select group of large-cap growth stocks, returns were broadly negative in May. The S&P 500 Index generated a total return of 0.4%, while the equal-weighted S&P 500 returned -3.8%. The top 5 contributors to performance (NVDA, GOOGL, AMZN, MSFT, APPL) added 2.4% to the Index’s return while the remaining 495 stocks in the Index detracted 2.0%. The Dow Jones Industrial Average, TSX Composite and FTSE 100 Index, which have more exposure to cyclical and value sectors, generated total returns of -3.2%, -5% and -5%, respectively. May’s returns were consistent with the trend witnessed throughout the year of narrow market leadership and growth stocks outperforming value.
Despite outstanding performance from a select group of large-cap growth stocks, returns were broadly negative in May. The S&P 500 Index generated a total return of 0.4%, while the equal-weighted S&P 500 returned -3.8%. The top 5 contributors to performance (NVDA, GOOGL, AMZN, MSFT, APPL) added 2.4% to the Index’s return while the remaining 495 stocks in the Index detracted 2.0%. The Dow Jones Industrial Average, TSX Composite and FTSE 100 Index, which have more exposure to cyclical and value sectors, generated total returns of -3.2%, -5% and -5%, respectively. May’s returns were consistent with the trend witnessed throughout the year of narrow market leadership and growth stocks outperforming value.
|
|
The recent rally in large-cap tech stocks has been staggering. The S&P 500 Information Technology sector generated a total return of 9.5% in May, bringing its year-to-date total return to +34%. While many factors have contributed to the rally, including investors buying large cap tech stocks to achieve benchmark exposure and falling bond yields, the excitement surrounding generative Artificial Intelligence (AI) has likely been the biggest driver of performance. Semiconductors have been in the limelight this year as they are among the biggest beneficiaries of the rise in AI. We believe the hype was justified by Nvidia’s blowout revenue guidance for Q2 ’23, which was more than 50% above the street and led to one of the biggest ever single day gains in market capitalization. Generative AI is also having an immediate impact in software, with Microsoft (MSFT) continuing to roll out “Copilot” capabilities for Office 365 applications. This functionality – which involves integration of OpenAI technology directly into the applications – is likely to significantly improve productivity for workers while simultaneously allowing MSFT to generate more revenue.
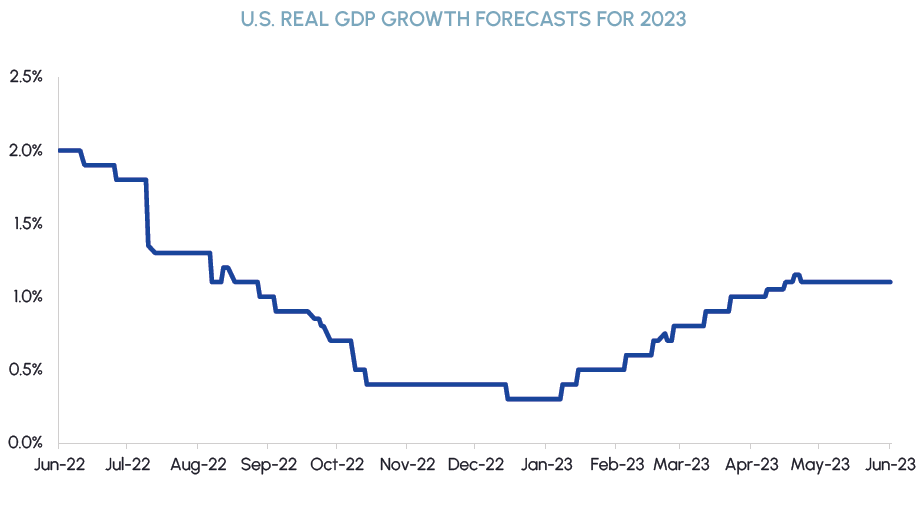
The outperformance that tech and consumer stocks have generated this year has been impressive but continued positive performance for the S&P 500 is unsustainable unless market breadth improves. While we remain cognizant of lingering market risks, recent economic data have given us reason to believe a catch-up trade from stocks that have lagged is more likely than a catch-down trade in tech stocks. 2023 US Real GDP growth forecasts have steadily increased since the beginning of the year, from 0.3% in January to approximately 1.1% today. The labour market has been extremely resilient, highlighted by the most recent jobs numbers in Canada and the US which significantly beat expectations and showed unemployment rates are still hovering around all-time lows. Inflation statistics have also continued their downward trend since last fall, which should support consumer spending and confirms we are near the end of the rate hike cycle.
|
|
In addition to a stable economic backdrop, the risk of a disruptive debt ceiling crisis has been averted. As we predicted in our last commentary, the Biden Administration and House Speaker Kevin McCarthy were able to strike a deal just days before the June 5th deadline that would have led to the US government being unable to pay its bills. While there are members of each party that have expressed grievances with the agreement, the Republican-controlled House ultimately voted 314-117 to support the deal. Banking stresses have also abated in recent weeks as regional bank stocks have stabilized and deposit outflows have slowed. These two developments have reduced tail risks and improved investor sentiment.
Real Estate
Middlefield Fund Tickers & Codes: MREL / MID 600 / RS / RA.UN / MSRE.UN
by Dean Orrico, President & CEO
Canadian REITs declined 4.6% in May which was in-line with the TSX Composite Index. The sector has returned 2.1% year-to-date but history suggests it may be on the cusp of a sustained breakout. Looking back over the past five Bank of Canada rate hike cycles, REITs typically underperform the TSX leading up to the first rate hike and the six to twelve months thereafter. After twelve months, REITs start to outperform. Performance has historically been especially strong in the periods 18 months and 24 months after the first hike, where REITs tend to outperform by 15-20% with high frequency. The Bank of Canada announced its first rate hike for the current cycle approximately 15 months ago on March 3rd, 2022. Put differently, we are entering a period following rate hikes when REITs have consistently outperformed the TSX by a significant margin.
|
|
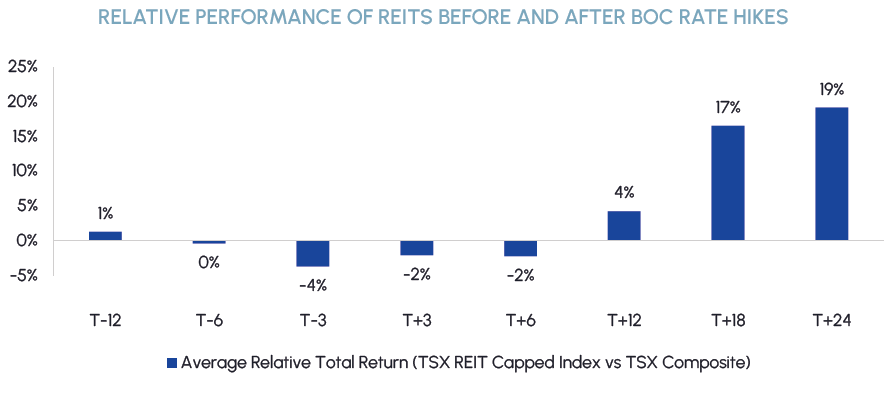
The historical performance, as evidenced in the chart above, is intuitive. As rates initially start going up, investors become concerned about the impact it will have on balance sheets and borrowing costs. Once the dust settles a year after the first hike, REITs are validated as a hedge against higher interest rates due to their ability to grow net operating income and realize higher rents. 2022 was a perfect storm for the commercial real estate sector, highlighted by a broad market downturn, rapidly rising interest rates and structural changes brought on by “work from home” dynamics. While office owners and lenders are facing the biggest market challenges, their negative sentiment is affecting the entire sector. We believe it is important to not paint all REITs with the same brush and are seeing a similar setup to past rate hiking cycles.
Industrial, multi-family, retail and select asset classes in the US such as manufactured housing remain our highest conviction real estate subsectors for investment. Companies in these areas are benefiting from demand that is outstripping supply and should be able to generate above-average growth in net operating income over the next several quarters.
Healthcare
Middlefield Fund Tickers & Codes: MHCD / MID 325 / SIH.UN
by Robert Moffat, Portfolio Manager
Healthcare acted as a source of funds for investors chasing the tech rally in May. The S&P 500 healthcare sector declined 4.3% this month, giving back nearly half of the gains it has generated since mid-March. Healthcare’s year-to-date underperformance in 2023 is second only to 1999, which was the peak of the tech bubble.
One factor that is likely weighing on the sector is a murky regulatory outlook heading into the fall. The Inflation Reduction Act (IRA) that was passed into US law last year allows drug pricing negotiations between the Centers for Medicare & Medicaid Services (CMS) and drug manufacturers. The initial list of drugs that will be eligible for drug price negotiations in 2026 will be released on September 1st of this year. Our view is that investors may be underestimating the impacts that IRA drug pricing risks could have on sentiment for biopharma stocks in the months ahead. We are tactically underweight biopharma in our healthcare funds and are monitoring companies that have higher exposure to IRA drug pricing risks such as Regeneron, Bristol-Myers and Johnson & Johnson. Despite the impact that IRA drug pricing could have on sentiment, we remain comfortable with the overall impact it will have on biopharma fundamentals. It is estimated that Medicare represents just 15% of global branded drug sales and there are several levers that drug companies can pull to mitigate the impacts of the IRA, including reconfigured launch strategies and legal challenges. Despite being a portfolio underweight today, biopharma companies have very stable and defensive earnings and will remain a core component of our dividend-paying healthcare funds going forward. We may opportunistically add to certain companies if they become oversold due to political rhetoric.
MedTech represents the biggest overweight exposure in our healthcare funds currently. In addition to the fundamental reasons we like MedTech, including recovering elective procedure volumes, easing supply chain and labour pressures, and less disruption from Covid in the hospital setting, it is also very insulated from the aforementioned IRA price negotiations. MedTech companies typically sell equipment and devices into hospitals and outpatient clinics, which have very different pricing dynamics than the drug channels. As a result, MedTech companies have not been pushing price increases on to customers for decades, and risks of pricing legislation in MedTech is extremely low.

Sustainable Infrastructure
Middlefield Fund Tickers & Codes: MINF / CLP.UN / MID 265 / MID 510 / ENS / ENS.PR.A
by Robert Lauzon, Managing Director & CIO
Enbridge’s mainline settlement in early May removed a major impediment to the market getting comfortable with the company’s outlook. With that, we think investor focus should now shift to its ability to grow the business, while undertaking a dynamic capital allocation strategy with respect to its annual discretionary cash flow, including buybacks and tuck-in acquisitions. In May, a federal district court hearing took place in Wisconsin to consider a motion requesting an injunction to shut down the Line 5 pipeline amid concerns of spring erosion along the riverbanks of the Bad River. The company has been working towards rerouting the pipeline around the Bad River Band’s traditional territory since 2019, although permits from the Department of Natural Resources remain outstanding. Once again, the district court judge declined to order the shutdown, citing significant economic and energy security implications for both Canada and the US.
The clean energy sector is experiencing significant growth, driven by an energy crisis in Europe, the Inflation Reduction Act (IRA) in the US and expanding green energy installations in China. This growth is apparent in the impressive earnings and financial performance of our investments in utilities companies, including National Grid and Centrica. Current government support for clean energy investments underpins our confidence in the sector.
A recent report from the International Energy Agency highlights that global renewable power capacity additions are expected to jump by a third, totaling 440 gigawatts (GW) this year. It marks an increase of 107 GW compared to last year and represents the largest rise in new capacity ever recorded. AES and Nextera Energy, two of our preferred names in the space, are actively scaling up their renewable energy capacity to meet the surging demand for clean energy resources. AES announced plans to triple its renewables capacity from 15 GW currently to approximately 40 to 45 GW by 2027. Similarly, Nextera charted a path to double its renewables capacity by 2026. Costs to implement clean energy witnessed a slight uptick in 2022 but are anticipated to ease in 2023, further supporting a positive outlook for these names. We expect demand to be the strongest for more mature technologies such as wind and solar, solidifying their position as pillars of low-emission power generation.
Technology & Communications
Middlefield Fund Tickers & Codes: MINN / SIH.UN / MID 925
by Shane Obata, Portfolio Manager
Tech stocks continued to outperform in May. The Nasdaq rose 5.9%, lifting its YTD return to an impressive 24.1%.
While we expect that semiconductors & infrastructure names will be the first to benefit from AI, we are also optimistic about the eventual benefits that should accrue to software companies. Right now, the focus is on generalized generative AI, or AI that can answer a broad range of questions. While this is certainly useful, we think that generative AI will eventually become more specialized. The companies that are best positioned to benefit are those with the best domain-specific data. This would include Salesforce in customer relationship management and customer service, Adobe in design and ServiceNOW in IT management. These companies don’t need to build their own AI capabilities, they simply need to apply the right technologies to their own proprietary datasets.
We also remain very positive on cybersecurity stocks. As the world continues to move online, the number of “attack surfaces” (e.g. Networks, applications, servers, etc.) is expected to grow rapidly. In addition, companies are storing more and more critical information and data online. As such, it is reasonable to expect that spending on cybersecurity initiatives will continue to rise. Our top pick in this space remains Palo Alto Networks (PANW). PANW, which was recently added to the S&P 500, provides GARP exposure in what is typically an expensive industry. Moreover, the company is becoming a platform provider of cybersecurity solutions and thus should benefit from vendor consolidation trends over time.

Resources
Middlefield Fund Tickers & Codes: MID 161 / ENS / ENS.PR.A / MID 265
by Dennis da Silva, Senior Portfolio Manager
Early in May, the price of gold approached its record high set in August 2020 but lost momentum through the rest of the month, ending its two-month winning streak. Gold was negatively impacted by rising US Treasury yields and a strong dollar as the market became more optimistic that a US debt ceiling deal would be reached while the probability of further rate hikes increased. For the near-term, we are encouraged to see gold’s new base forming above the US$1,900/oz level after being stuck at US1,800/oz for the last several years. The TSX Gold sub-industry was down 7.2% in May, underperforming the price of gold which was down 1.4%.
Crude oil market sentiment has deteriorated as the narrative continues to encapsulate recession fears and its effect on demand. We are sanguine about the prospects for oil as we anticipate a soft landing for the economy. Recently OPEC+ reached a comprehensive agreement which included an extension of the voluntary 1.66 million bbls/d production cut from the end of 2023 until the end of 2024. More importantly, Saudi Arabia announced an additional 1 million bbls/d unilateral production cut starting in July for a month but that can be extended, emphasizing that the country would do “whatever is necessary to bring market stability to the market.” We expect it to be supportive for oil prices over the medium-term.
The start of summer tends to be a seasonally soft period for fertilizer markets. That said, we were surprised at the market’s irrational sell-off in May when we believe the cycle is bottoming. The indiscriminate decline in fertilizer equities combined with fertilizer commodity prices beginning to find a floor should provide an attractive entry point for the sector in the near-term. We’re encouraged by the pace of potash volume movement since the start of Q2, as well as the impact lower prices are having on end buyer sentiment. We believe what we have witnessed over the last couple years has been demand deferral, not destruction. Several regions including Europe have undergone several years of skipped potash application due to war-induced limited availability, record-high prices, and increasingly severe weather conditions including drought. From a stock perspective, we can’t recall seeing investor sentiment this negative in over a decade. Companies have recently lowered guidance to below street estimates, creating an attractive setup for companies to beat and raise in the quarters ahead.
ESG: Environmental, Social and Governance
Middlefield Fund Tickers & Codes: MDIV / MINF / CLP.UN / SIH.UN / MSRE.UN
by Stephen Erlichman, Chair, ESG (Environmental, Social and Governance)
One sees the word “greenwashing” in the press on a regular basis. What does the term mean and what are the implications of greenwashing?
According to IOSCO (the International Organization of Securities Commissions), greenwashing is the practice of misrepresenting sustainability-related information, practices or features at any point throughout the investment value chain by any market participant (whether issuers, asset managers, financial advisers, ESG rating agencies or data providers).
In Canada, greenwashing is addressed predominantly under two legal regimes, namely securities laws and competition laws. Under Canadian securities laws, there are general provisions that provide for civil liability as well as regulatory offences for misrepresentations, and those general provisions also can be applicable to ESG misrepresentations. Remedies for ESG misrepresentations can be available not only against an issuer, but also against directors and officers.
The CSA (Canadian Securities Administrators) have identified greenwashing in issuers’ required continuous disclosure documents (e.g. prospectuses or annual information forms) as well as in issuers’ voluntary disclosure documents (e.g. sustainability or ESG reports). The CSA have stated that issuers should avoid misleading promotional language and that issuers should ensure that all public disclosures, whether voluntary or required, are factual and balanced.
Greenwashing can occur not only in disclosures by issuers, but also in the investment activity of asset managers as well as in the marketing of investment products. To date, we are not aware of greenwashing cases that have been publicly reported in Canada in the investment management industry, but ESG greenwashing cases have been reported elsewhere in the world, especially in the U.S. (for example, by the SEC against Goldman Sachs Asset Management and against BNY Mellon Investment Adviser) and in Australia (for example, by Australia’s securities regulator against Vanguard Investments).
On the competition front, Canada’s Competition Bureau is increasingly receiving complaints from environmental advocacy groups raising greenwashing allegations (i.e., alleged false or misleading sustainability-related representations to the public). Under the Competition Act, there are both criminal and civil provisions prohibiting misleading representations and deceptive marketing practices. The focus under the Competition Act is whether a company has made a representation to promote a product that creates a materially false or misleading general impression for consumers.
In the Competition Bureau’s 2021 greenwashing bulletin, the Bureau advises that one must ensure that all statements: are truthful and not misleading; are specific; are substantiated and verifiable; do not result in misinterpretations; do not exaggerate the environmental benefits of the product; and do not imply that the product is endorsed by a third-party organization if it is not.
Greenwashing has become a focus of regulators, as well as private plaintiffs, not only in Canada but in many countries around the world. Hopefully the cases which have been brought by regulators and by private plaintiffs will result in market participants “walking the talk” on their future ESG disclosures so that going forward those disclosures will be clear, factual and verifiable.

Exchange Traded Funds (ETFs)
Mutual Funds (FE | F)
TSX-Listed Closed-End Funds
| Fund | Ticker | Strategy |
|---|---|---|
| MINT Income Fund | MID.UN | Equity Income |
| Sustainable Real Estate Dividend Fund | MSRE.UN | Sustainable Real Estate |
| International Clean Power Dividend Fund | CLP.UN | Sustainable Power |
| Middlefield Global Real Asset | RA.UN | Real Assets |
| Sustainable Innovation & Health Dividend Fund | SIH.UN | Innovation & Healthcare |
TSX-Listed Split Share Corps. (Class A | Preferred)
| Fund | Ticker | Strategy |
|---|---|---|
| E-Split Corp. | ENS | ENS.PR.A | Energy Infrastructure |
| Real Estate Split Corp. | RS | RS.PR.A | Real Estate |
LSE-Listed Investment Fund
| Fund | Ticker | Strategy |
|---|---|---|
| Middlefield Canadian Income Trust | MCT | Canadian Equity Income |