


Index
Macro Update
by Dean Orrico, President & CEO and Robert Lauzon, Managing Director & CIO
After a strong start to the year, North American equity markets gave back some of their early gains in February with the S&P 500 and TSX Composite each returning -2.5%. Growth stocks continued to outperform, highlighted by the NASDAQ declining just 1% and still up nearly 10% year-to-date. European equities fared much better in February with most indices generating positive returns.
Following several months of continuously declining inflation data, January’s CPI report showed that inflation rose 0.5% month-over-month and 6.4% compared to a year ago. The US added 517,000 jobs in January while the unemployment rate reached 3.4%. Higher-than-expected inflation indicators have caused an abrupt change in the market narrative as a result. Investors have shifted focus back towards the central bank tightening cycle and away from the soft landing vs. no-landing debate.
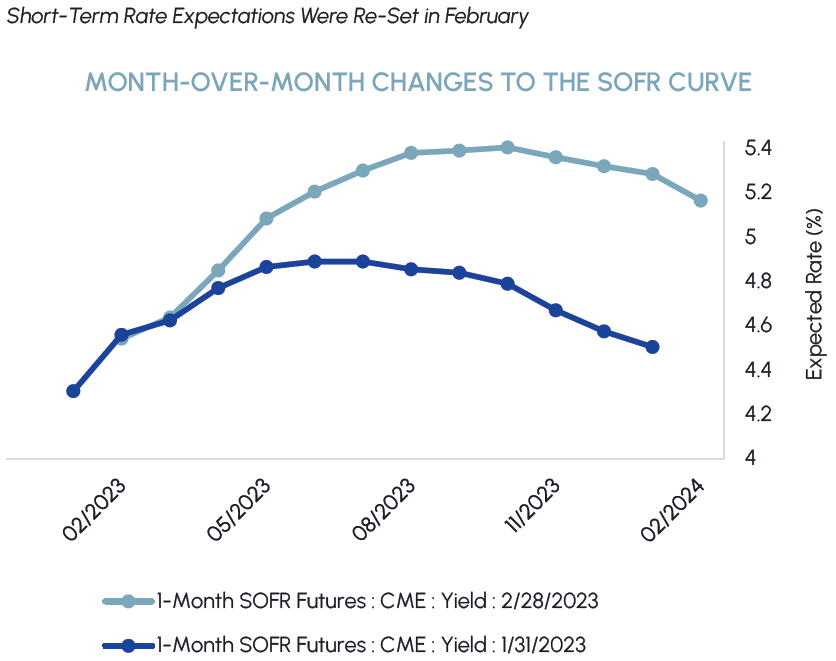
The bond market was very quick to reprice recent data, as highlighted below by the Secured Overnight Financing Rate (SOFR) forward curve. The chart shows that the Federal Reserve is now expected to hike short-term borrowing rates by twenty-five basis points three more times this year, reaching a terminal rate of 5.4%, before starting to cut in early 2024. The longer end of the curve has also risen quickly with US 10-year yields now at 4% and approaching their October 2022 peak of 4.25%. Until economic data supports less hawkish monetary policy, we believe yields will continue to be a headwind for equity multiples.
|
|
Notwithstanding the likelihood of a “higher-for-longer” interest rate environment, we are encouraged by the overall health of the economy. Consensus 2023 US GDP growth forecasts have risen from 0.3% to 0.7% recently and the Atlanta Fed’s GDPNow model points to 2.8% growth in Q1. The Bureau of Labor Statistics reported that the number of job openings increased to 11 million in December while the unemployment rate is at its lowest level since 1969. Other recent data showed Americans increased spending at retailers and restaurants in January by the most in nearly two years. While higher interest rates pose a risk to equity valuations and sentiment, a hard-landing recession would likely be much worse for the stock market. We believe the probability of this scenario occurring has fallen in recent weeks and are optimistic that a soft, or even a no-landing, scenario will play out.
We remain focused on companies that can navigate higher rates in the near-term. Companies with exposure to floating rate debt or substantial upcoming debt maturities will likely face higher interest costs which will weigh on margins. We also favour companies with strong pricing power that can pass through cost inflation to their customers.
Healthcare
Middlefield Fund Tickers & Codes: MHCD / MID 325 / SIH.UN
by Robert Moffat, Portfolio Manager
It has been a challenging start to the year for healthcare investors with the sector lagging the S&P 500 by more than 10%. Last year’s outperformers, which included large-cap biopharma, health insurers and drug distributors have led to the downside. As we highlighted in our 2023 outlook, the biggest risks facing healthcare stocks entering the year were related to positioning rather than fundamentals. Healthcare has posted the highest rate of positive Q4’22 earnings surprises while forward-looking updates have been largely in-line with expectations. We remain committed to owning these companies in our healthcare strategies due to their high profitability, low leverage and consistent and growing dividend income.
MedTech companies have performed relatively well this year and our funds are overweight this industry relative to the benchmark. Dexcom and Abbott are among our favourite names and represent the two leaders in the continuous glucose monitoring (CGM) space. CGMs are devices that people with diabetes wear to track their blood glucose levels. Apple made headlines in late February when it revealed its own “moonshot” CGM that uses a non-invasive laser technology to read blood glucose levels. Considering the severity of the disease, and the high emphasis that people living with diabetes place on accuracy, reliability, and convenience of their CGM, we believe the threat of Apple’s novel technology to FDA regulated CGMs is overblown. In addition, there are serious barriers to entry from a regulatory and manufacturing standpoint that would make it very difficult to compete with the regulated incumbents in the diabetes population. Both stocks have since recovered from the Apple headlines and received a further boost in early March when the Centers for Medicare & Medicaid Services expanded its coverage of CGM devices to include type 2 diabetes patients that use basal insulin in addition to the type 1 population. The decision effectively expands coverage for three to four million individuals in the United States and should support continued growth in the CGM market.

Real Estate
Middlefield Fund Tickers & Codes: MREL / MID 600 / RS / RA.UN / MSRE.UN
by Dean Orrico, President & CEO
Canadian REITs continued to outperform the broader market in February, returning 0.3%. The performance was noteworthy in a month where 10-year bond yields rose by more than 40 basis points. Year-to-date, the sector has returned 11.1% and is the second-best performing sector in the TSX behind Information Technology.
Housing affordability is a growing issue in Canada, exacerbated by record immigration. Annual rent growth exceeded 10% for a ninth straight month in January. Canada Mortgage and Housing Corporation estimates that an additional 3.5 million housing units need to be built by 2030 to achieve affordable housing for everyone in Canada. Our real estate portfolios are positioned to capture the expected growth in rents and development activity through positions in multi-family REITs with exposure to Canada’s most attractive markets.
|
|
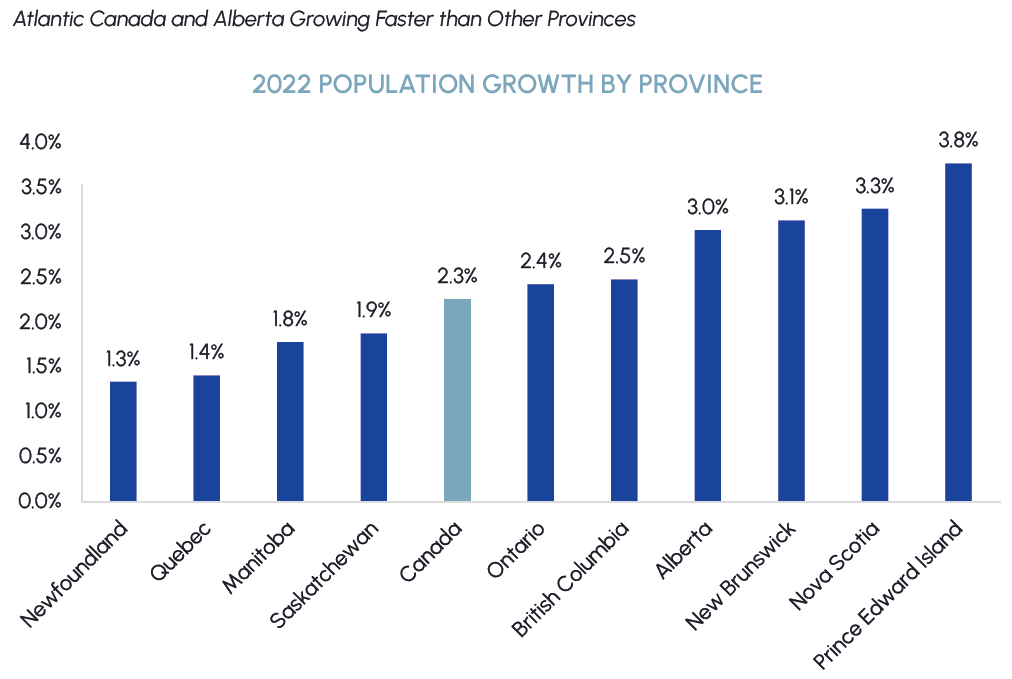
Killam Apartment REIT generates 64% of its net operating income from Atlantic Canada which has the highest population growth rate in the country. The company reported that its occupancy increased to an all-time high of 98.2% in Q4 ’22 while its leasing spreads on turnover reached 12%. In addition to the healthy organic growth from higher rents, Killam’s development program distinguishes it from its peers. The company completed three new developments in 2022 and currently has three additional developments underway which will add 320 new suites to its portfolio over the next two years. Boardwalk REIT is another name with differentiated exposure to fast-growing markets. Over 60% of its portfolio is concentrated in Alberta where the population grew by 3% in 2022. Unlike most other Canadian provinces, the Alberta rental market does not have rent control which allows Boardwalk to capture higher market rents faster than its peers. The company announced that it expects to generate same property NOI growth of 8.5% to 12.5% in its 2023 guidance and raised its monthly distribution by 8.3%.
Sustainable Infrastructure
Middlefield Fund Tickers & Codes: MINF / CLP.UN / MID 265 / MID 510 / ENS / ENS.PR.A
by Robert Lauzon, Managing Director & CIO
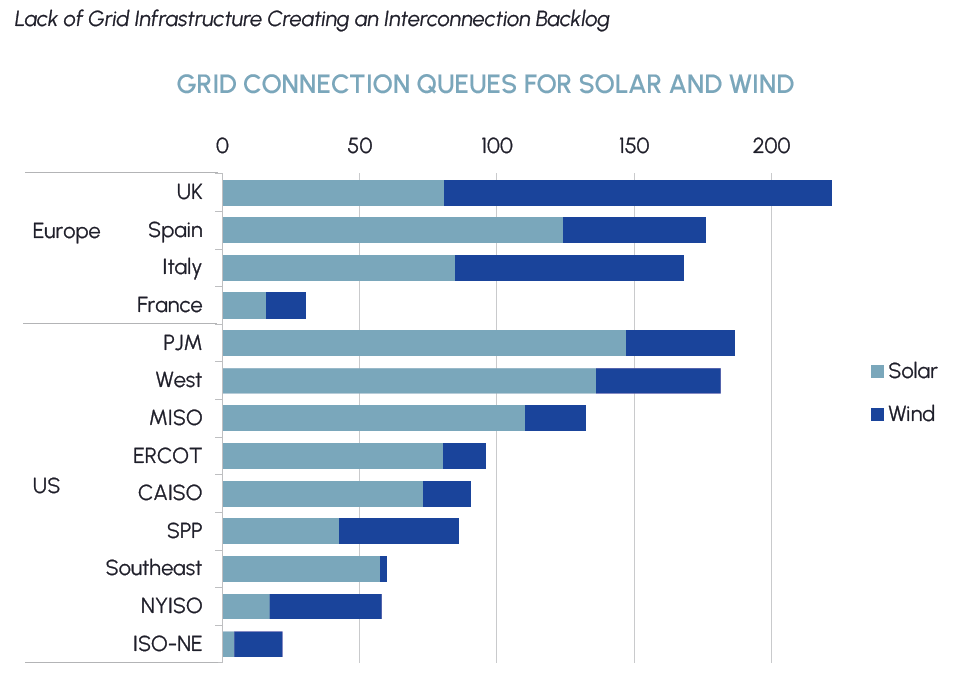
The International Energy Agency reported that energy-related carbon dioxide emissions rose at a lower rate than expected in 2022, largely due to the rapid growth of clean energy sources such as solar, wind, electric vehicles, and heat pumps. To keep pace with the additions of renewable energy capacity, investments in the power grid need to increase. Iberdrola estimates that for every €1 of investment in renewables, €0.70 needs to be invested in grid infrastructure to allow connectivity of new projects to the existing networks. Currently, there is a backlog of approximately 500 GW of wind and 1,000 GW of solar projects awaiting interconnection across the US and Europe. According to Bloomberg New Energy Finance, annual grid investments are projected to grow at a rate of 3.4% to $636 billion by 2050 which translates into a tremendous opportunity for utilities that have high exposure to transmission and distribution. We are particularly bullish on Iberdrola, which has a large networks business in Spain and the UK that it plans to expand. We have exposure to complementary industries as well including cables and electrical equipment through companies such as Prysmian. Advancements in energy storage will also play a pivotal role in balancing energy supply and demand, providing further opportunities to invest in the sector.
|
|
Enbridge reiterated its core strategy and value proposition at its recent investor day. Its conventional business segments, which are benefitting from North America’s booming LNG industry, will be complemented by low carbon opportunities. The company stressed its commitment to maintaining a strong balance sheet and a low-risk business model with growth from contracted projects fueling growing dividends. The update reinforced our expectation that over the next several years, Enbridge should deliver annual double digit returns driven by a 6.5% dividend yield and 4-6% EPS/EBITDA growth.
Technology & Communications
Middlefield Fund Tickers & Codes: MINN / SIH.UN / MID 925
by Shane Obata, Portfolio Manager
Tech stocks outperformed again in February with the Nasdaq Composite of just -1%, which compares to the S&P 500 and Dow Jones Industrial Average returns of -2.5% and -3.9%, respectively. The price action this year is a reminder of why investors should maintain some exposure to tech stocks. Investor focus has firmly shifted from revenue growth to profitability – a development that we welcome as long-term investors.
On the earnings front, Tech EPS revisions have improved this year with significant upward revisions across sub-industries such as communications equipment and application software. In our view, this is an indication that investors may have been too negative going into Q4 earnings. Moreover, we continue to see cost rationalizations across our coverage, with Salesforce perhaps being the best example of this trend. No fewer than five activist investors are currently involved in the stock and the bull case is straightforward: Get expenses down and improve margins. Salesforce is already moving quickly and just announced that operating margins for 2024 should come in at 27%, well above previous expectations for 22%. This playbook is one that we expect will be applied across the tech sector for years to come. While macro uncertainty may weigh on revenue growth in the short-term, we believe that opportunities for margin improvement exist throughout the tech sector, which should drive long-term outperformance.
Meta is another great example of this theme. Mark Zuckerberg has called this the “year of efficiency” and has focused the company on productivity above all else. Meta’s advertising business appears to be improving with new AI-driven systems showing promising results. While we continue to have low expectations for the Metaverse division, it’s worth noting that most of Meta’s past investments were targeted at improving the company’s core offerings and AI capabilities. We continue to believe that Meta is well positioned to capitalize on continued growth in the tech sector, especially as we move past the effects of the Apple privacy updates and as scrutiny surrounding TikTok increases.

Resources
Middlefield Fund Tickers & Codes: MID 161 / ENS / ENS.PR.A / MID 265
by Dennis da Silva, Senior Portfolio Manager
February proved to be a busy month for M&A in the gold space. In a surprise move, the world’s largest gold producer Newmont Mining made a US$17B offer to acquire Australia’s largest gold producer, Newcrest Mining. The combination of the two gold miners would bring them back together after almost 25 years. A week after the Newmont news, the gold M&A theme was extended in North American markets with a US$825MM takeover of Sabina Gold by B2Gold. Recent activity underscores the sector’s requirement to replenish resource inventories of mature assets and the lack of new discoveries globally.
We believe oil prices could move higher over the next several months. Increased optimism related to recovering Chinese crude demand has largely offset potential recession-related concerns. Russia has banned the export of petroleum products to the G7 plus Australia for five months (beginning February 1st) in response to the US$60/bbl price cap on Russian crude imports (effective December 5, 2022). The EU also banned imports of Russian refined products (starting February 5th) which further limits the flow of oil and related products to developed markets. With recent escalations in the Ukraine war, we do not expect geopolitical tensions to ease or trade agreements to be reached in the near-term.
Closer to home, we have seen increasing airtime for the Pathways Alliance (Pathways). Pathways is a unique collaboration that was formed in 2021 when Canadian Natural Resources, Suncor Energy, Cenovus Energy, Imperial Oil, MEG Energy and ConocoPhillips Canada collectively representing 95% Canada’s oil sands production joined forces to create one of the world’s largest decarbonization projects. The project’s goal is to achieve net zero production for Scope 1 and 2 emissions from Canada’s oil sands industry by 2050. At an estimated price tag of $75 billion, Pathways will be executed in a three-phase approach. It is anchored by carbon capture, utilization & storage (CCUS) and a 400 km pipeline that will connect the oil sands to a carbon sequestration hub near Cold Lake, Alberta. Phase 1 has been estimated at $24.1 billion, with commencement in 2026.
The supply-side pressures of the Ukraine war, lower utilization of crop nutrients and continued extreme weather events have laid the foundation for tight crop inventories and strong farmer incomes. Global grain and corn inventories are near 20-year lows and spot prices of corn, soybeans and wheat are 25%-50% above their 10-year averages. These conditions should drive strong farm profitability and provide an incentive for farmers to increase use of fertilizers and replace aging equipment to boost production and maximize crop yields. Fertilizer equities are only trading slightly above pre-war levels, offering a compelling entry-point given the structural fertilizer market changes that occurred through 2022. We estimate that fertilizer companies could generate 20-30% free cash flow yields in 2023-2024.
ESG: Environmental, Social and Governance
Middlefield Fund Tickers & Codes: MDIV / MINF / CLP.UN / SIH.UN / MSRE.UN
by Stephen Erlichman, Chair, ESG (Environmental, Social and Governance)
There are stories in the news every week about the use of artificial intelligence (AI) in various aspects of business and everyday life. It is not surprising, then, that there have been discussions and articles written about the use of AI in environmental, social and governance (ESG) investing and, more broadly, about the relationship between AI and ESG.
With respect to the use of AI in ESG investing, a core issue is how do financial service firms and other companies deal with the mountains of data stemming from ESG regulations that exist in the European Union (EU) and may soon exist in the U.S. and Canada. For example, the EU’s Sustainable Finance Disclosure Regulation and proposed Corporate Sustainable Reporting Directive require asset managers and portfolio companies to collect and provide numerous data points. In addition, more data on companies is being gathered to deal with the Task Force on Climate-Related Financial Disclosures (TCFD) initiative (which likely will become a framework for various environmental disclosures in the U.S. and Canada) as well as the initiative of the International Sustainability Standards Board (ISSB) to create an ESG reporting framework. AI can be increasingly useful for asset managers — as well as their portfolio companies — to gather, understand and use this data to satisfy ESG regulatory requirements.
Although using AI can assist asset managers and portfolio companies in their ESG analyses and disclosures, there also are E, S and G issues that arise from the use of AI, which are highlighted below.
In regard to E, the carbon footprint from processing and storing data can be extremely large. For example, AI needs to be trained via deep learning in order that it can be used by asset managers or portfolio companies, but training is a high energy intensive process that can have a large negative E impact.
In regard to S, algorithms used by AI may discriminate against certain groups. According to the Bank of International Settlements, AI models “can reflect biases and inaccuracies in the data they are trained on, and potentially result in unethical outcomes if not properly managed”. For example, the press have reported cases where AI used in lending decisions resulted in racial bias by charging certain minority borrowers higher interest rates on their mortgages.
In regard to G, boards of directors and senior management might lack the skills to understand how AI is gathering and using data, how that data should be interpreted and how to oversee the use of AI in organizations. A recent study conducted by Brunel University London found a consensus among surveyed directors and management that boards will have to learn to deal with some major issues emerging from AI, while surveyed directors and management also believed that “insufficient work is being done on AI Ethics”.
Accordingly, as the use of AI no doubt will continue to increase in the years ahead, it will become increasingly important to understand the pros and cons of AI usage and how that usage ties into ESG investing and broader ESG issues.

Exchange Traded Funds (ETFs)
Mutual Funds (FE | F)
TSX-Listed Closed-End Funds
| Fund | Ticker | Strategy |
|---|---|---|
| MINT Income Fund | MID.UN | Equity Income |
| Sustainable Real Estate Dividend Fund | MSRE.UN | Sustainable Real Estate |
| International Clean Power Dividend Fund | CLP.UN | Sustainable Power |
| Middlefield Global Real Asset | RA.UN | Real Assets |
| Sustainable Innovation & Health Dividend Fund | SIH.UN | Innovation & Healthcare |
TSX-Listed Split Share Corps. (Class A | Preferred)
| Fund | Ticker | Strategy |
|---|---|---|
| E-Split Corp. | ENS | ENS.PR.A | Energy Infrastructure |
| Real Estate Split Corp. | RS | RS.PR.A | Real Estate |
LSE-Listed Investment Fund
| Fund | Ticker | Strategy |
|---|---|---|
| Middlefield Canadian Income Trust | MCT | Canadian Equity Income |
Traded Funds (ETFs)
Mutual Funds (FE | F)
TSX-Listed Closed-End Funds
| Fund | Ticker | Strategy |
|---|---|---|
| MINT Income Fund | MID.UN | Equity Income |
| Sustainable Real Estate Dividend Fund | MSRE.UN | Sustainable Real Estate |
| International Clean Power Dividend Fund | CLP.UN | Sustainable Power |
| Middlefield Global Real Asset | RA.UN | Real Assets |
| Sustainable Agriculture & Wellness Dividend Fund | AGR.UN | Sustainable Agriculture |
| Sustainable Innovation & Health Dividend Fund | SIH.UN | Innovation & Healthcare |
| Workplace Technology Dividend Fund | WORK.UN | Enterprise Technology |
TSX-Listed Split Share Corps. (Class A | Preferred)
| Fund | Ticker | Strategy |
|---|---|---|
| E-Split Corp. | ENS | ENS.PR.A | Energy Infrastructure |
| Real Estate Split Corp. | RS | RS.PR.A | Real Estate |
LSE-Listed Investment Fund
| Fund | Ticker | Strategy |
|---|---|---|
| Middlefield Canadian Income Trust | MCT | Canadian Equity Income |