


Index
Macro Update
by Dean Orrico, President & CEO and Robert Lauzon, Managing Director & CIO
Global markets rallied in January with the S&P 500, TSX Composite and MSCI World gaining 6.3%, 7.4% and 7.1%, respectively. Market breadth has been rising. For example, the percentage of S&P 500 constituents trading above their 200-day moving averages has been trending higher year-to-date, with the last reading exceeding 75%. We would not characterize the rally as “low quality”, since we are seeing strong participation across the entire index. That said, we are slightly concerned with the composition of stocks that are leading the price resurgence, many of which can be characterized as “meme stocks” or highly-shorted names.
The biggest driver of the recent market rally has been mounting evidence of disinflation. In December, headline CPI growth fell to 6.3% in Canada and 6.5% in the US, down from last summer’s respective highs of 8.1% and 9.1%. Eurozone inflation is expected to fall from its recent peak of 10.1% to 3.1% by year-end while UK inflation is forecasted to fall from its October high of 11.1% to 4.2% over the same period. Importantly, US consumers expect the downward trajectory to continue. The University of Michigan Surveys of Consumers showed year-ahead inflation expectations fell to the lowest level in nearly two years. The same survey showed consumer sentiment rising to a nine-month high.
The Bank of Canada (BoC) agrees with the US consumer. It projects CPI inflation in Canada to fall to 3% by the middle of 2023 and back to the 2% target in 2024. In conjunction with the BoC’s January 25th decision to raise the overnight lending rate by 25 bps to 4.5%, Governor Tiff Macklem announced the BoC expects to pause rate hikes and weigh the impact of its rapid tightening. As previously indicated, we agreed with the BoC’s decision to front-load rate increases in 2022 and welcome this dovish tone. Since inflation remains higher outside Canada, we expect other central banks, including the US Fed, to maintain their hawkish stance for a few more months before shifting to a similar policy.
While our base case is for inflation to continue tracking lower, lessons from the 1970s teach us to remain wary of claiming victory against inflation too soon. In our view, there are two critical factors to monitor before we can have confidence that the inflation issue has been fully resolved. First, the labour market has proven extremely resilient and has introduced an element of stickiness to inflation. Structural changes have occurred since the onset of the pandemic with many workers permanently leaving the workforce or finding non-conventional sources of income that are not accounted for in labour statistics. Second, China’s resurgence from lockdowns has resulted in higher forecasted demand this year and a corresponding increase in commodity prices.
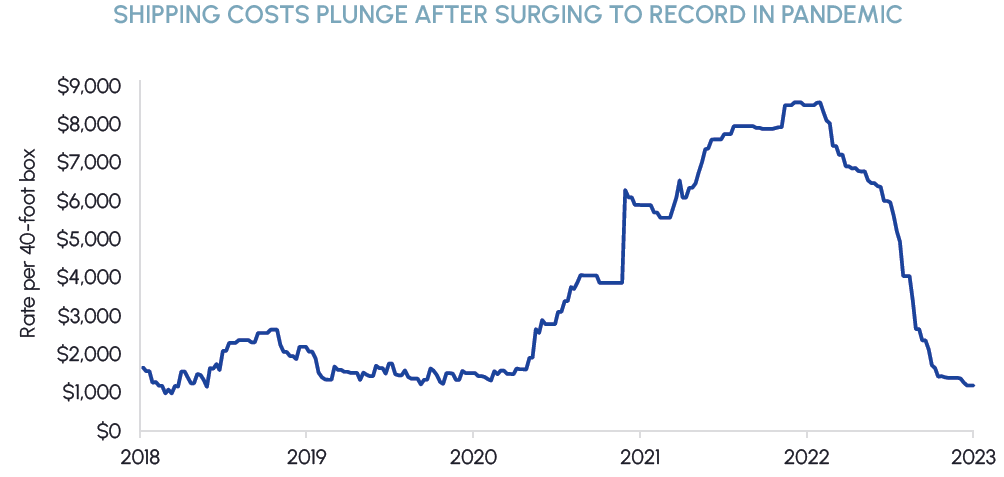
While both dynamics have inflationary impacts, we are not overly concerned that they will derail inflation’s downward path. There have been a multitude of layoff announcements in recent weeks (predominantly in tech) and we are seeing signs that wage inflation is slowing. Inflationary impacts of the China reopening should be offset by the disinflationary effects of a more normalized global supply chain. This dynamic is evident in declining shipping costs, which have been a major contributor to the recent trend and are now back to pre-COVID levels.
|
|
Fundamental sources of market support remain intact but further expansion of valuation multiples is becoming increasingly difficult to justify. Per Bloomberg, consensus 2023 earnings for the S&P 500 sit at about $221, implying a price-to-earnings multiple of nearly 19x. We have an optimistic market outlook over the medium term but acknowledge the current risk/reward is becoming less appealing. Our funds are generally positioned defensively with an emphasis on companies that have clean balance sheets, stable earnings, and attractive dividends.
Healthcare
Middlefield Fund Tickers & Codes: MHCD / MID 325 / SIH.UN
by Robert Moffat, Portfolio Manager
Healthcare was the second worst performing sector in January as investors rotated into cyclicals from defensives. Other defensive sectors such as staples and utilities also struggled. Despite the recent price action, we think it is too early to abandon the defensive trade and remain highly confident in Healthcare for 2023. The sector provides a good balance of revenue resiliency and earnings protection. This has been confirmed by Q4’22 reports thus far, with healthcare companies showing better sales and EPS growth than the broader market.
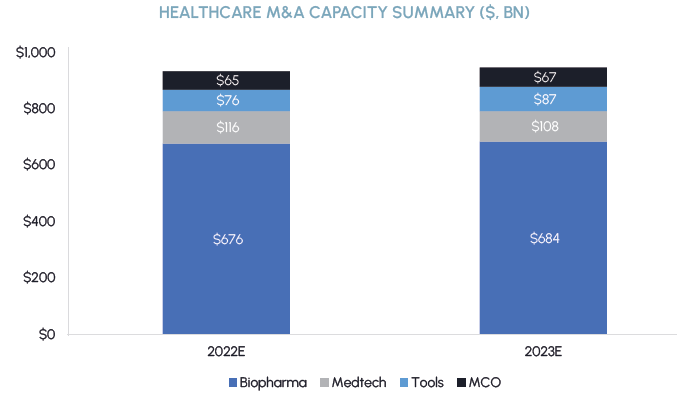
We expect M&A to play a role in the sector’s performance this year. Many healthcare companies have benefited from COVID-19 revenue tailwinds over the past several years and balance sheets have never been stronger in the sector. Goldman Sachs estimates that US healthcare companies have nearly $1 trillion of M&A capacity, most of which is concentrated in the biopharma industry. We see an opportunity for large incumbents with approaching patent expiries to augment their drug pipelines through strategic M&A. In addition, many potential M&A targets that are developing innovative new products need cash to fund their R&D efforts. Given the challenging capital markets environment today, we expect these companies will become more amenable to M&A discussions in the months ahead. M&A has historically supported valuations in the sector and we expect a larger volume of deals to materialize this year.
|
|
The outlook for MedTech has improved considerably and we continue to like the setup for the group. Over the past 60 years, the medical equipment industry has outperformed the S&P 500 by approximately 9% during periods of high and falling inflation. Recent surveys of hospital executives indicate that utilization of inpatient and outpatient services are expected to exceed pre-COVID levels this year. In addition, the labour environment continues to improve dramatically with waning demand for travel nursing and agency pay rates down 20-25% since December. Job postings have also fallen by 6% this year which may indicate recruiting efforts at hospitals are starting to bear fruit. Expectations for 2023 were adjusted lower during the second half of last year and we believe companies are positioned to beat-and-raise their earnings estimates this year.

Real Estate
Middlefield Fund Tickers & Codes: MREL / MID 600 / RS / RA.UN / MSRE.UN
by Dean Orrico, President & CEO
REITs had an excellent start to 2023 with the Canadian and US real estate sectors returning 10.7% and 9.9%, respectively. We met with the management teams of numerous Canadian REITs in January and were encouraged by their widespread optimism for the sector in 2023. Despite the impressive rally to start the year, we continue to believe there is excellent value in select names. Industrial, multi-family and retail represent the bulk of our current exposure in the sector, with complementary allocations to emerging asset classes such as data centers, towers, seniors housing and manufactured housing communities.
The industrial real estate market remains extremely hot in Canada, highlighted by CBRE’s quarterly industrial markets stats report. In Q4’22, national industrial rents grew by 31% year-over-year and 6% quarter-over-quarter. Leasing volumes came in 27% higher than their five-year average while average sale prices increased 29% compared to last year. Despite such a supportive fundamental backdrop, Canada’s publicly traded industrial REITs were among the worst performing REIT sectors in 2022 with Granite REIT and Dream Industrial returning -31.9% and -28.4%, respectively. Even though both companies rallied more than 18% in the month of January, they still trade at a discount to their respective NAVs with private market valuations much higher than those implied by Granite and Dream’s current share prices.
The office sector represents an area with a higher level of uncertainty. Longer lease terms, work-from-home trends and a steady flow of new supply all contribute to a cloudy outlook. It was reported in early January that Canada’s office vacancy rate hit a record high of 17.1% at the end of last year. The vacancy rate for Manhattan office space finished the year at a similar level and saw leasing decline by 43% year-over-year in Q4. As a result, we are underweight office REITs relative to the benchmark but maintain select exposure to names trading at deep discounts to NAV and to those focused on emerging and differentiated property types such as life science office.
Sustainable Infrastructure
Middlefield Fund Tickers & Codes: MINF / CLP.UN / MSRE.UN / MID 265 / MID 510 / ENS / ENS.PR.A
by Robert Lauzon, Managing Director & CIO
Clean energy stocks were up this month, delivering a positive return of 3.8%. We expect 2023 to be a strong year of global renewable deployments, fueled by strategic partnerships between industry leaders and increased investments in capacity expansion. One of the top players in the clean energy space, Enphase, recently announced a partnership with Enerix to expand its reach in Germany and Austria. The water industry witnessed one of the largest M&A offers in recent history, with Xylem offering to buy Evoqua in an all-stock deal. Both Xylem and Evoqua are leaders in their respective verticals and have been our top picks for investment opportunities in this area. We are optimistic about the outcome of this acquisition, as it is expected to generate cost and revenue synergies and to potentially lead to further industry consolidation.
The European clean energy industry witnessed a crucial advancement with the release of the European Commission’s first draft of the Green Deal Industrial Plan. This is meant to level the playing field for European companies and is a direct response to the US Inflation Reduction Act. The Green Deal Industrial Plan is expected to work in conjunction with existing funding plans such as the €250 billion Recovery and Resilience Facility. It also allows for the mobilization of an additional €372 billion from InvestEU and a further €40 billion from the Innovation Fund, helping to accelerate investments into low carbon and clean energy technologies that are expected to enhance the competitiveness of Europe’s net-zero industry over the next decade. One of the key objectives of this plan is to cut the red tape around government approval processes and minimize bureaucracy surrounding clean energy initiatives through a simplified regulatory environment. We are optimistic that this announcement will further catalyze the growth of low-carbon technologies in Europe and provide solid upside to our preferred names in the sector.
Technology & Communications
Middlefield Fund Tickers & Codes: MINN / SIH.UN / MID 925
by Shane Obata, Portfolio Manager
Tech stocks outperformed in January, with the Nasdaq Composite rising 10.7%. While the momentum reversal (favoring laggards versus leaders) partially explains the result, we believe that investors are coming back around to secular growth. Cloud computing and cybersecurity are highly durable, long-term themes that will persist well beyond any economic deterioration that might occur in the short-term.
Based on our research, cybersecurity remains a top priority for Chief Information Officers. This is no surprise given the rising incidence of attacks and what seems like new headlines every week. While the entire space is becoming increasingly attractive, we continue to recommend a disciplined approach. Though odds of a soft landing have been rising, we remain focused on high quality companies with proven business models, attractive free cash flow profiles and reasonable valuations. Two companies that fit these criteria are Palo Alto Networks (PANW) and Fortinet (FTNT). Though some are concerned about the viability of their firewall businesses, we believe they are much more defensive and stickier than investors give them credit for. In support of this thesis, we would note that PANW and FTNT have continued to gain market share while pushing through multiple price hikes. In addition, both companies have been successful in cross-selling new products and stand to benefit from vendor consolidation.
|
|
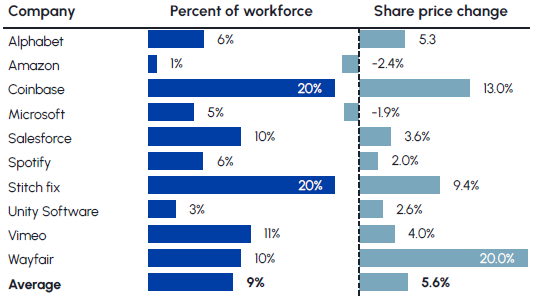
Cost normalization remains a key theme in the tech sector, and for good reason. The recent frenzy of job cuts has brought some relief to investors who want assurance that mega cap tech companies can protect their margins. While tens of thousands of jobs have been cut, they represent a drop in the bucket when compared to the hundreds of thousands that were added during the COVID pandemic (i.e. from the end of 2019 to the end of 2021). We think this is why cuts have been met with positive reception by the market. According to Bloomberg, big US tech companies that have recently announced job cuts have seen their shares gain an average of 5.6% in the following session.

Resources
Middlefield Fund Tickers & Codes: MID 161 / ENS / ENS.PR.A / MID 265
by Dennis da Silva, Senior Portfolio Manager
Gold has had an encouraging start to the year, driven in part by expectations of a less hawkish Fed, a weaker U.S. dollar and continued fears of recession/stagflation. While gold set a record annual average price of $1802 during 2022, investors are still significantly underweight both gold and gold equities.
Demand for gold soared (excluding OTC) to an 11-year high in 2022. According to the World Gold Council, key to the surge was a 55-year high for purchases by central banks, which was more than double the purchases in 2021. Most of the central bank buying came from emerging markets, with Turkey the largest buyer while China, India, Egypt, Qatar, Iraq, the UAE, and Oman all significantly boosted their gold reserves over the year. During January, the spot gold price was up almost 6% to levels not seen since mid-2022, driving material outperformance in the S&P/TSX Global Gold Index, which was up 9.6%.
Oil majors Exxon Mobil, Chevron, BP, Shell and TotalEnergies are expected to report a combined profit of US$190 billion for 2022, according to estimates from analysts. Chevron kicked the earnings season off with a profit double what they reported in 2021. U.S. giant ExxonMobil announced nearly US$56 billion in earnings last year, a record for both itself and for any U.S. or European oil firm. The windfall makes Exxon the third-most-profitable company of 2022, behind only Apple and Microsoft. According to the Wall Street Journal, Shell, Europe’s largest oil and gas company, finished January reporting the highest profits in the firm’s 115-year history, smashing the previous record in 2008. Flush with cash, the energy giants are expected to use their windfall profits to reward shareholders with higher dividends and share buybacks, as evidenced by Chevron’s announcement that it was launching a $75 billion share buyback and raising its dividend. The expected volatility of the macro environment serves as a reminder that the best opportunities in the energy sector will be the companies showing a combination of strong free cash flows, balance sheet strength, quality inventory depth, and increasing return of cash to shareholders.
Fertilizer companies performed well in January, lifted by broader markets, higher crop prices and the typical seasonal January/February trade ahead of spring application demand and often optimistic producer forecasts. Currently farmers are experiencing a tailwind of higher revenues and lower costs. Crop prices were boosted as a January USDA report reduced crop production estimates, especially in the US, resulting in lower inventory projections that reflect continued tight agriculture markets. The Green Markets North American Fertilizer Index fell 16% for the 4 weeks ending January 27, the lowest since May 2021. Falling input prices could bring relief to farmers, who have faced rising costs for everything that goes into producing food, from chemicals and fuel to equipment and labor. A continuing trend could encourage farmers to plant more acres while applying more nutrients, boosting production while bringing down the cost of food for consumers.
ESG: Environmental, Social and Governance
Middlefield Fund Tickers & Codes: MDIV / MINF / CLP.UN / SIH.UN / MSRE.UN
by Stephen Erlichman, Chair, ESG (Environmental, Social and Governance)
A major governance (i.e., the G of ESG) focus of institutional investors at public companies is the compensation of companies’ CEOs and other senior officers. There are many possible compensation issues that can be considered by institutional investors under the G rubric when determining whether to invest in particular public companies and, once invested, when deciding how to vote their portfolio securities at shareholder meetings on a Say on Pay vote, on a vote for the election of directors or on a shareholder proposal. Some of the possible compensation issues include: the amount of compensation awarded to the CEO and other senior officers; the ratio of CEO compensation to average compensation at the company; how much compensation is short term versus long term; what are the performance metrics used to determine the amount of short or long term incentive awards; are ESG factors being used as a metric in incentive awards and, if yes, for short or for long term awards.
In January, the Canadian Coalition for Good Governance (CCGG) released a paper entitled “Management-Shareholder Alignment: Effective Equity Ownership Policies”, which looks at another important compensation issue. CCGG, whose members are institutional investors across Canada with over $6 trillion of assets under management, is a very important part of the G ecosystem in Canada and thus public companies seriously consider CCGG’s views on G issues. The paper starts with the proposition that “institutional investors have long believed that governance risks are reduced by linking management interests with those of shareholders” and that “one of the most effective means to do this is by encouraging management teams to become shareholders of the companies they manage”. CCGG reviewed the 2022 proxy circular disclosure of the 237 companies included in the TSX Composite Index to understand the structure of their share ownership policies and the extent to which their CEOs rely on unvested share-based compensation awards to meet share ownership requirements, because according to CCGG when “unvested awards are relied upon to meet share ownership requirements, the link between management and shareholder interests is weakened”.
Among the various finding in the CCGG study, CCGG states that of the 210 (out of the 237) companies with a share ownership policy, “145 or 67% give value to unvested compensation (primarily restricted stock units and performance stock units) for the purposes of compliance with the share ownership policy”. CCGG also states that on average “CEOs of the 210 companies … were required to hold approximately 4.7 times their annual base salaries in common shares, deferred share units, and other vested and unvested share-based awards”, but when CCGG assessed these share ownership requirements relative to total director compensation (TDC) which includes base salary, cash bonus, stock options and share-based awards, “the average requirement equated to less than 1.0 times annual TDC granted to CEOs”.
CCGG concludes that boards of directors “should encourage greater common share ownership amongst officers of the company” then sets out five recommendations “to support this objective and strengthen management alignment with shareholder interests”:
- Establish share ownership requirements that continually build an officer’s economic interest over time. One approach would be to change from an ownership requirement with a defined threshold to an annual share purchase requirement.
- Establish and express share ownership requirements relative to TDC rather than base salary (given that on average base salary represents only 21% of TDC for all Index issuers).
- Require CEOs and other officers to meet a majority of their ownership requirements through common shares alone.
- If credit is given for compensation awards within share ownership policies, the credit should be limited to awards that have vested, are full value in nature (i.e., stock options are not “full value” and would not be counted, even if vested), and which must be held until retirement.
- Share ownership policies that determine the value of securities held by officers at the higher of market value or acquisition price do not align well with shareholder interests; a more appropriate policy would value securities at either market value (CCGG’s preference) or at acquisition price.
It will be interesting to see which of CCGG recommendations will be followed by Canadian public companies in 2023 and in future years.

Exchange Traded Funds (ETFs)
Mutual Funds (FE | F)
TSX-Listed Closed-End Funds
| Fund | Ticker | Strategy |
|---|---|---|
| MINT Income Fund | MID.UN | Equity Income |
| Sustainable Real Estate Dividend Fund | MSRE.UN | Sustainable Real Estate |
| International Clean Power Dividend Fund | CLP.UN | Sustainable Power |
| Middlefield Global Real Asset | RA.UN | Real Assets |
| Sustainable Innovation & Health Dividend Fund | SIH.UN | Innovation & Healthcare |
TSX-Listed Split Share Corps. (Class A | Preferred)
| Fund | Ticker | Strategy |
|---|---|---|
| E-Split Corp. | ENS | ENS.PR.A | Energy Infrastructure |
| Real Estate Split Corp. | RS | RS.PR.A | Real Estate |
LSE-Listed Investment Fund
| Fund | Ticker | Strategy |
|---|---|---|
| Middlefield Canadian Income Trust | MCT | Canadian Equity Income |