


Index
Macro Update
by Dean Orrico, President & CEO and Robert Lauzon, Managing Director & CIO
Equity markets continued to rally in July, bringing the winning streak of the S&P 500 Index to five months. There have been 37 prior five-month winning streaks since 1928, and 29 of them extended to a sixth month (78.4%). Given the increasingly positive market narrative, which includes cooling inflation, robust earnings, the end of monetary tightening and firming growth, it is possible that history repeats itself and the recent momentum continues.
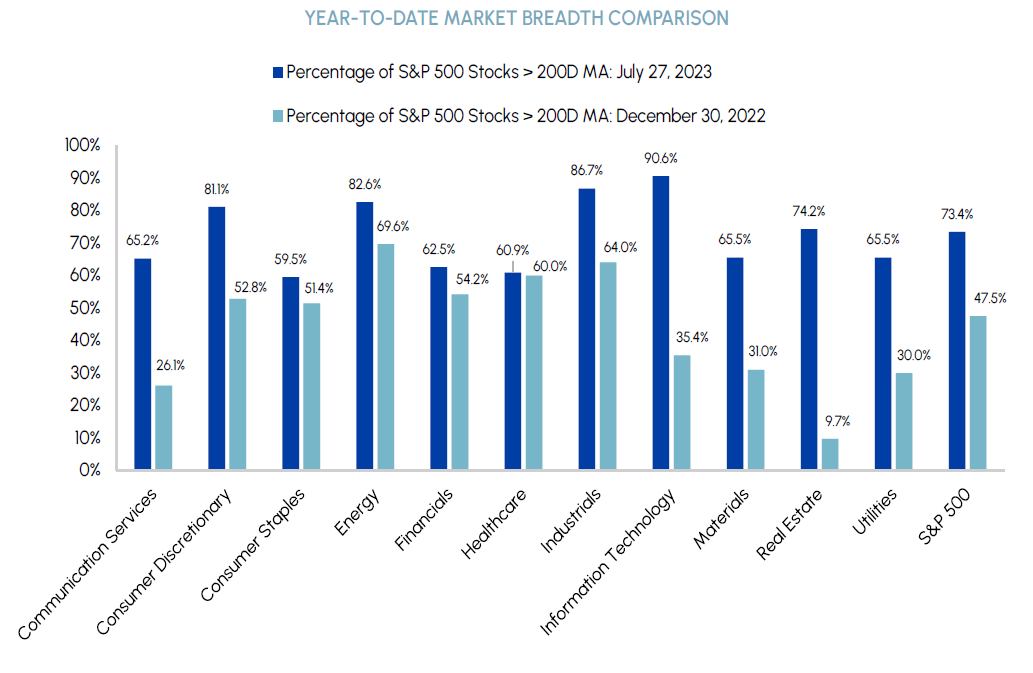
Market breadth is a key factor we have been following to gauge the sustainability of the recent market rally. The Dow Jones Industrial Average (the Dow), which has more of a cyclical tilt, has lagged the tech-concentrated S&P 500 by more than 12% year-to-date. We are encouraged by the July outperformance of certain sectors that lagged in H1, including energy and financials. The Dow closed higher for 13 straight sessions through July 26th, its longest series of positive closes since 1987. Moreover, 73% of stocks in the S&P 500 are trading above their 200-day moving averages, well above the start of the year where fewer than half traded similarly.
|
|
We are in the thick of Q2 earnings season and results have been broadly positive. Of the 420 S&P 500 companies that have reported thus far, 79.8% have beat consensus earnings expectations by an average of 7.3% (as of August 4, 2023). As we have previously predicted, companies are benefiting from disinflationary tailwinds and improving margins. Going forward, it is likely that inflation will stabilize, removing the positive disinflationary impact on earnings for a large group of companies. We expect this to be a short-term phenomenon during the Q3 reporting period in October/November but maintain a positive outlook on earnings over the longer-term.
One of the biggest drivers of recent economic strength has been the US consumer, propped up by a tight labour market. The most recent Non-Farm Payrolls report showed that the US economy added 187,000 jobs in the month of July while the unemployment rate remained low at 3.5%. The June Job Openings and Labor Turnover Survey (JOLTS) report also suggests that demand for labour remains very strong. The ratio of job openings to unemployment sits at 1.6x which is well above pre-pandemic norms. In addition, real wages are rising, resulting in higher purchasing power for consumers. When gauging the health of the economy, employment data is arguably the most important factor to watch given its implications for consumer spending. Currently, the labour market is not showing any signs of cracks, which reinforces our view that a soft landing is the most likely path forward for the US economy.
Treasury yields have been rising and the long end of the yield curve has steepened in recent weeks. Although rising yields result in higher borrowing costs, we view these recent rate developments positively as they imply an improved growth backdrop. We remain focused on companies with low leverage and minimal financing requirements in the current environment.
Real Estate
Middlefield Fund Tickers & Codes: MREL / MID 600 / RS / RS.PR.A / RA.UN / MSRE.UN
by Dean Orrico, President & CEO
Real estate lagged the broader market in July, returning 1.8% in Canada and 1.3% in the US. Notwithstanding the ongoing challenges in the office sector, we remain very confident in the healthy real estate fundamentals across the commercial real estate space and expect unit prices to appreciate in the second half of 2023. Q2 earnings have been overwhelmingly positive thus far, further confirming our view on the sector.
Dream Industrial REIT (DIR) represents a top 5 holding across our real estate strategies. The company reported strong Q2 results and raised its guidance in early August which highlights why we are so bullish on the stock at current levels. Same property net operating income grew by over 11% compared to Q2 2022, driven by rent increases on expiring leases that exceeded 60% in Canada. Following DIR’s acquisition of Summit REIT (together with Singapore-based sovereign wealth fund GIC) in February 2023, over 60% of DIR’s portfolio is concentrated in Canada where industrial fundamentals are among the best in the world. DIR’s net debt to total asset ratio is also very manageable at 36%, further confirming our view that the best quality REITs have done a good job working down their overall debt levels. DIR is currently trading at a 15% discount to conservative net asset value estimates of $17.00 per unit. We expect DIR to trade closer to its NAV over the next twelve months which, together with its 5% dividend yield, represents a total return opportunity of approximately 20%.
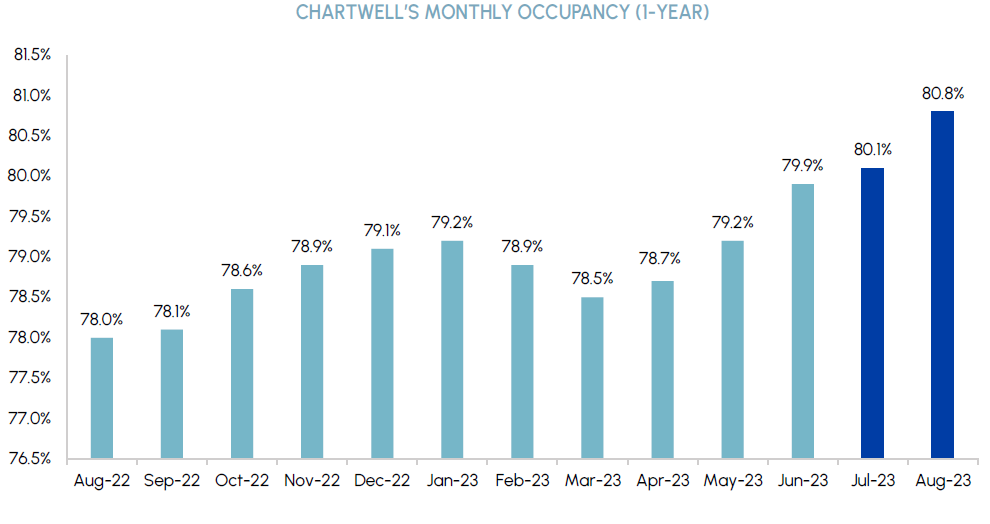
Chartwell (CSH) is another core position in our healthcare and real estate funds that we have been adding to throughout the year. We believe occupancy recovery is the single-most important performance indicator for the stock over the next several years and we’ve been encouraged by recent progress. CSH recently announced that it had exceeded its May occupancy forecast by 60 basis points to reach 79.2%, revised its June forecast higher to 79.9%, and introduced a forecast for July which shows continued upward momentum to 80.1%. The company stated that interest in its retirement homes is picking back up and leasing activity is resembling a more traditional pre-COVID environment. Over the past two years, CSH has lagged US peers in terms of both net operating income recovery and unit price performance, largely due to lagging occupancy levels. We believe CSH is now positioned to deliver peer-leading earnings growth through 2024 at a CAGR of 20%.
|
|
Healthcare
Middlefield Fund Tickers & Codes: MHCD / MID 325 / SIH.UN
by Robert Moffat, Portfolio Manager
Despite returning 1% in July, healthcare was the worst performing sector in the S&P 500 this month. We are becoming increasingly bullish on the sector after several months of underperformance and improving market breadth.
UnitedHealth Group, the world’s largest private health insurer, warned investors in June that costs would come in higher than initially expected due to higher utilization of outpatient care facilities. Historically, higher utilization has translated into more spending on healthcare equipment and devices. MedTech companies that have reported Q2 results thus far have confirmed this trend with beat and raise quarters from Abbott, Stryker and Boston Scientific, among others. MedTech companies were heavily impacted by macro headwinds during the pandemic but are now starting to demonstrate above-average growth. Tight conditions in the labour market should provide a further boost to earnings power as higher employment results in more people covered by health insurance.
Becton Dickinson (BDX) was added to our healthcare portfolios in H1. BDX sells the “picks and shovels” of the healthcare industry, with two thirds of sales coming from products that cost less than $100 such as needles, catheters and blood collection accessories. It holds a dominant market position in the low-capital categories it competes in which results in better pricing power than its peers. In addition to its steady base business, the company has been focused on improving its growth profile, executing on $3 billion of M&A deals over the last two years and increasing spending on R&D. The company’s Alaris IV infusion pump, which is used to deliver fluids, medications and blood, received FDA approval in July. The approval should kick off a steady cycle of new product launches over the next two years which we expect to drive 6% revenue and 12% earnings growth. As a result, BDX possesses GARP characteristics, trading at 20x forward earnings compared to peers with similar growth profiles trading closer to 23x.

Sustainable Infrastructure
Middlefield Fund Tickers & Codes: MINF / CLP.UN / MID 265 / MID 510 / ENS / ENS.PR.A
by Robert Lauzon, Managing Director & CIO
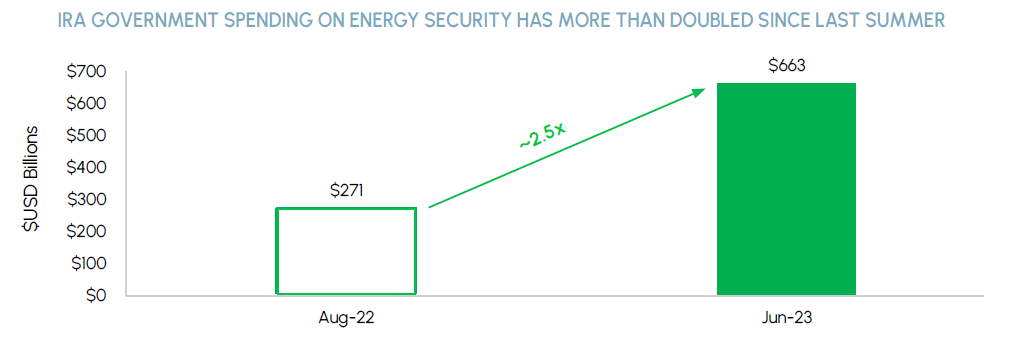
The electrification megatrend was evident in Eaton’s most recent earnings report. The company, which is one of our top picks in electrical equipment, delivered record quarterly EPS and lifted guidance for the full year to reflect 16% growth over 2022. Eaton also reported strong growth in its Electrical Sector backlog, which was up 22%. In addition to electrification, the company is also benefiting from other megatrends such as infrastructure spending and reindustrialization. Eaton noted the massive ramp up in government spending focused on energy security that has been driven by the US IRA.
|
|
The company also stated that there have been $686 billion in cumulative mega projects ($1 billion+) announced for the US and Canada since January of 2021, representing a 3x increase versus the normal run rate. While the stock is not cheap, we think that it deserves to trade at a premium valuation relative to its peers. Going forward, we expect Eaton to deliver >10% EPS in each of the next few years, supported by double digit growth in end markets such as data centers, utilities and electric vehicles.
The solar industry has been under pressure recently, especially on the residential side. While we were especially disappointed by results from SolarEdge and Enphase, we would remind investors that these are companies that have the potential to deliver better than 20% annualized revenue and EPS growth through year-end 2025. Unlike many of their cleantech peers, both companies are consistently profitable. Put differently, these are real businesses and not just story stocks. Following the recent price weakness, these stocks appear highly attractive on a price/earnings-to-growth (PEG) basis.
Technology & Communications
Middlefield Fund Tickers & Codes: MINN / SIH.UN / MID 925
by Shane Obata, Portfolio Manager
The inverse relationship between yields and technology stocks is approaching extreme levels i.e., rising rates are weighing on tech valuations more than usual. Although this poses a risk to stock multiples, we expect the economy to avoid the long-awaited consumer recession which would be bullish for the long duration tech sector. We continue to believe that rates are at or near a peak for the current cycle. With that backdrop in mind, we think tech can continue to perform well in H2’23 and into 2024. This is especially true if we are right about a reacceleration in cloud services growth and a recovery in the PC market in H2’23.
With respect to momentum, the Nasdaq 100 recently exhibited extremely overbought conditions, as measured by its spread relative to its 200-day moving average. These conditions have only occurred seven other times since the index’s inception in the mid-1980s. While the signal was typically followed by negative short-term performance, the longer-term results have been overwhelmingly positive. According to Bespoke, the Nasdaq 100 was higher every time over the following 12 months of reaching these levels, with an average gain of nearly 27%. We are sharing this study not to advocate for short-term market timing, but rather to illustrate that extreme overbought conditions often occur in the context of a broader bull market.
Tech earnings have been in an extended bear market for multiple quarters. Going forward, earnings growth within the tech sector is expected to be much higher than the broader market. If our base case is correct, and tech earnings are starting to turn the corner, then a secular bull market in tech is likely in its early stages.

Resources
Middlefield Fund Tickers & Codes: MID 161 / ENS / ENS.PR.A / MID 265
by Dennis da Silva, Senior Portfolio Manager
Gold continued to trade in a tight range through July as markets digested improving economic data. Despite rising broader markets, a strengthening US dollar and looming rate hikes – all historical headwinds for gold – it was encouraging to see the price of gold hold a key technical support level of US$1,900/oz during the month. The TSX Global Gold Index was up 3.0% in July, slightly better than the commodity price, which appreciated 2.3%.
Copper remains in a similar holding pattern, caught between a stalling Chinese economic recovery and historically low metal stockpiles. Copper’s long-term demand fundamentals remain attractive, supported by multiple growth drivers including grid modernization, urbanization and electric vehicle adoption. Supply constraints should further support copper prices in the near-term. The world’s largest copper producer, Chilean state-owned Codelco, cut copper guidance in July, citing poor grades and higher costs. Codelco’s woes are part of an industrywide story as new ore deposits become costlier to develop. Our preferred stocks for copper exposure are Teck Resources and Capstone Mining – both of which have attractive projects throughout the Americas and proven operational track records.
The voluntary production cuts announced by OPEC+ in April, together with Saudi Arabia’s unilateral cut of 1 million barrels per day in July are beginning to have their desired effects. WTI crude futures increased 15.7% in July, supporting a 9.3% return in the TSX Capped Energy Index. US crude stocks were down 17 million barrels in the last week of July, the largest weekly draw since the EIA began tracking weekly data in 1982.
LNG Canada, the largest private infrastructure project in Canadian history, announced that it plans to start flaring and testing its facilities next summer – a positive sign for hitting targets of coming online in 2025 and ramping to full capacity by early 2026. Through the end of the decade, there are approximately 7 Bcf/d of proposed LNG projects in Canada, representing almost 40% of Canada’s current production of 18 bcf/d. In the US, current export capacity is 13 Bcf/d, or ~13% of supply. That number is expected to grow to 30 Bcf/d by the end of the decade with 10 Bcf/d of projects already sanctioned or under construction. Canadian natural gas producers will benefit immensely from greater exposure to international prices over the coming decade and are positioned for significant growth. Tourmaline is currently our favourite gas-weighted name, partly due to its robust shareholder return expectations which are being driven by dividend payments and share buybacks. At current strip pricing, Tourmaline is equipped to pay an implied H2 dividend yield of 4.5% (including special dividends) in addition to its share repurchase program where the company plans to acquire 5% of its outstanding shares.
ESG: Environmental, Social & Governance
Middlefield Fund Tickers & Codes: MDIV / MINF / CLP.UN / SIH.UN / MSRE.UN / MID 265
by Stephen Erlichman, Chair, ESG (Environmental, Social and Governance)
In July’s ESG Commentary, we wrote about the June 26 publication by the International Sustainability Standards Board (ISSB) of two voluntary International Financial Reporting Standards (IFRS) which aim to improve the transparency, consistency and comparability of ESG information disclosed by public companies around the world. The two voluntary disclosure standards are called “IFRS S1 General Requirements for Disclosure of Sustainability-related Financial Information” and “IFRS S2 Climate-related Disclosures”. The standards integrate the recommendations of the Task Force on Climate-related Financial Disclosures (TCFD) and incorporate industry-based disclosure requirements derived from the Sustainability Accounting Standards Board (SASB).
There have been various developments regarding IFRS S1 and S2 since their publication on June 26, some of which we describe below.
On July 5, the Canadian Securities Administrators (CSA) announced that they welcomed the publication of IFRS S1 and S2 and commended the ISSB “for developing a global framework for investor-focused disclosure that is responsive to market demand for more consistent and comparable disclosure”. The CSA also noted that its members — being Canada’s various provincial and territorial securities commissions — “are responsible for developing climate-related disclosure requirements for reporting issuers in Canada”, then stated that “CSA staff intend to conduct further consultations to adopt disclosure standards based on ISSB Standards, with modifications considered necessary and appropriate in the Canadian context”. The CSA concluded its announcement by stating that a “further market update from the CSA will follow in the coming months”.
On July 10, the Financial Stability Board (FSB) announced that IFRS S1 and S2 “fully incorporate the recommendations of the TCFD”. As such, the FSB noted that the IFRS standards mark “the culmination of the work of the TCFD” which had been established in 2017 at the request of the FSB, and thus starting in 2024 the ISSB will take over from the TCFD the monitoring of the progress on companies’ climate-related disclosures.
On July 25, the International Organization of Securities Commissions (IOSCO) announced its endorsement of IFRS S1 and S2. IOSCO then called on “its 130 member jurisdictions — capital markets authorities that regulate more than 95% of the world’s securities markets (which include Canada and our securities regulators) to consider how they can incorporate the ISSB Standards into their regulatory frameworks to deliver consistency and comparability of sustainability-related disclosures worldwide”. IOSCO noted that this endorsement “echoes IOSCO’s endorsement of the IFRS Accounting Standards over 20 years ago, which helped underpin widespread comprehensive adoption of IFRS Accounting Standards enabling them to become the truly global language of accounting — trusted by investors and companies worldwide and required for use by more than 140 jurisdictions”.
The foregoing announcements by the CSA and IOSCO suggest that, going forward, securities regulators in Canada and around the world will be working toward transforming the IFRS S1 and S2 voluntary reporting standards into legal disclosure requirements for the companies they regulate, and, as stated above, we will hear more from the CSA “in the coming months”.

Exchange Traded Funds (ETFs)
Mutual Funds (FE | F)
TSX-Listed Closed-End Funds
| Fund | Ticker | Strategy |
|---|---|---|
| MINT Income Fund | MID.UN | Equity Income |
| Sustainable Real Estate Dividend Fund | MSRE.UN | Sustainable Real Estate |
| International Clean Power Dividend Fund | CLP.UN | Sustainable Power |
| Middlefield Global Real Asset | RA.UN | Real Assets |
| Sustainable Innovation & Health Dividend Fund | SIH.UN | Innovation & Healthcare |
TSX-Listed Split Share Corps. (Class A | Preferred)
| Fund | Ticker | Strategy |
|---|---|---|
| E-Split Corp. | ENS | ENS.PR.A | Energy Infrastructure |
| Real Estate Split Corp. | RS | RS.PR.A | Real Estate |
LSE-Listed Investment Fund
| Fund | Ticker | Strategy |
|---|---|---|
| Middlefield Canadian Income Trust | MCT | Canadian Equity Income |