


Index
Macro Update
by Dean Orrico, President & CEO and Robert Lauzon, Managing Director & CIO
September didn’t live up to its bad reputation this year with the market rallying through the historically difficult month. The S&P 500 returned 2.1%, marking the fifth consecutive month of gains for the Index and the best first three quarters of a year since 1997.
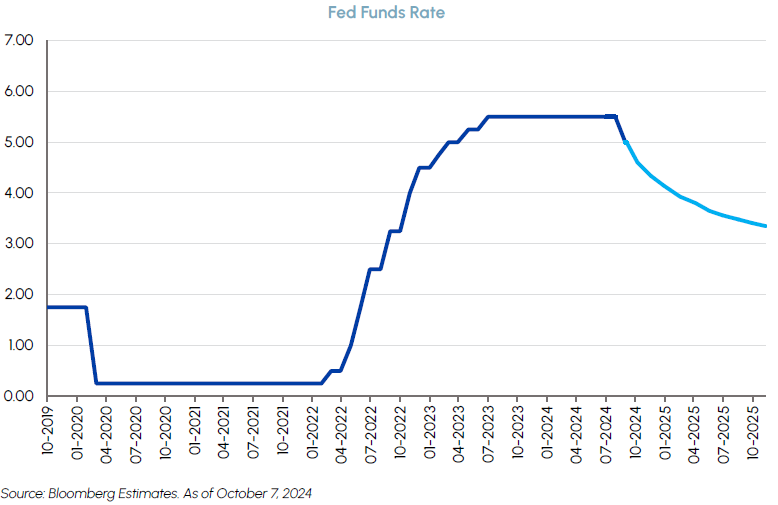
There were several important factors to follow this month but the most impactful developments came from policy easing. The FOMC reduced the fed funds target rate by 50 basis points, above the 25 basis point cut anticipated by consensus. Fed Chair Powell framed the decision as a “recalibration” aimed at protecting the strong labor market from downside risks. This move comes amid continued progress towards the 2% inflation goal and represents a clear shift in focus away from inflation towards employment. The hot September jobs report confirms a soft-landing has been achieved and we would gladly accept better underlying growth for a more moderate pace of Fed rate cuts over the coming months. Whether the next rate cut south of the border is later this year or early 2025 is less important than the general direction of rates and where they will settle over the next two years. Currently, the futures market is projecting the Fed Funds rate to be below 3.5% by the end of next year which is 1.5% below where it is today.
 |
Another form of policy easing came from China this month in what is being referred to as its “stimulus bazooka.” The Chinese government announced bold measures in both monetary and fiscal policy to stem deflation and meet the country’s annual growth target of 5%. Monetary measures include cutting the reserve requirement ratio by 0.5%, reducing short-term interest rates, and lowering mortgage rates for existing loans. On the fiscal front, the Ministry of Finance is planning to issue special sovereign bonds to stimulate consumption and could inject $140 billion into the country’s largest state banks. The announcements are aimed at accelerating lending and bolstering a declining property market – outcomes that could have broad implications for the global economy.
Canada is positioned to benefit from China’s stimulus bazooka. The TSX Composite returned 3.2% in September and closed at an all-time high on October 1st. Canadian stocks, particularly in the resource sectors, responded positively to the announcements from China in late September, before tensions between Iran and Israel caused oil prices to spike even further in early October. China is a major consumer of other Canadian exports as well, including lumber, precious metals and agricultural products. Canadian exporters should be beneficiaries of renewed demand tailwinds if the Chinese government’s stimulus program has its desired effects. The TSX is trading at just 15x forward earnings and Canadian equities currently offer compelling growth at a reasonable price.
As we enter the fourth quarter, our market outlook remains broadly optimistic. Disinflation, healthy earnings growth, monetary easing combined with China’s stimulus are all powerful tailwinds that should sustain the recent momentum we have seen in the market. That said, October is historically the most volatile month of the year and we enter Q4 with the S&P 500 trading at more than 21x forward earnings – the upper end of its historical range. We would not be surprised if we got a healthy market pullback in the near-term, but we would view any short-term weakness as a buying opportunity given the attractive fundamental backdrop.
Real Estate
Middlefield Fund Tickers & Codes: MREL / MID 600 / RS / RS.PR.A
by Dean Orrico, President & CEO
REITs continued to perform well in September, generating a total return of 5.6%. Since late June, the TSX Real Estate Sector has returned 24.4%. Despite the impressive rally, we maintain the view that REIT fundamentals are on solid footing and there is additional upside embedded in current unit prices.
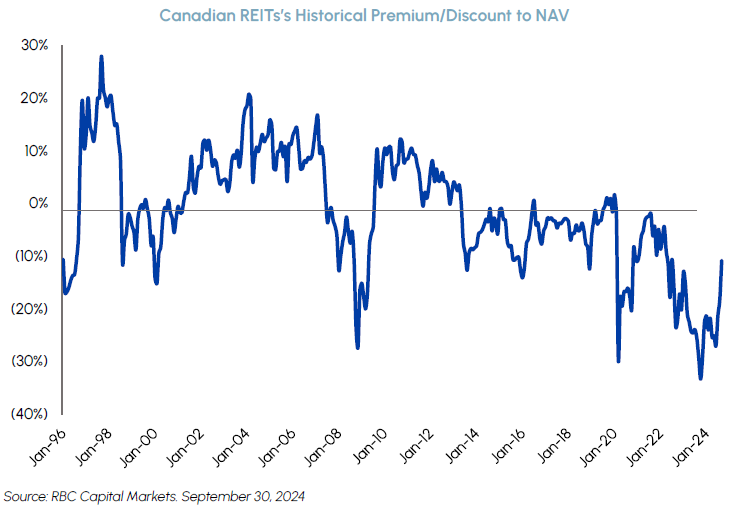
Against a backdrop of rising interest rates, many companies and analysts lowered their net asset value (NAV) estimates over the past two years. This was a prudent decision to reflect higher capitalization rates across the real estate sector. We often cite the discount/premium to which REITs trade relative to their NAVs as it offers a useful measurement in comparing a company’s stock price to its intrinsic value. With interest rates now declining, a trend we expect to continue for several more quarters, we believe there is a high likelihood that NAVs will start to increase over the next twelve months. The below chart from RBC shows that REITs are still trading at a 10% discount to NAV on average, before making any significant adjustments to current NAV estimates. In addition to the price-to-NAV discount narrowing further, we expect NAV growth to act as an additional tailwind for the sector going forward.
 |
Last month, we outlined a bullish case for retail REITs in Canada, supported by record population growth and historically low new supply. One of our preferred names in retail is Primaris REIT (PMZ). PMZ’s portfolio comprises enclosed retail properties across Canada in markets where it has established itself as the locally dominant player. On September 24th, PMZ held its inaugural Investor Day where the company introduced 3-year growth objectives, including a 3% increase to its occupancy rate (from 93% to 96%), annual FFO/unit growth of 4-6%, and 2-4% annual increases in its dividend. PMZ plans to achieve these goals by high-grading its portfolio through a new capital allocation strategy, which involves over $500 million of net acquisitions that will be funded by an equal amount of planned non-core asset dispositions. Considering PMZ’s pristine balance sheet, its institutional shareholder base and proven management team, we believe PMZ can leverage its relatively low cost of capital to execute on this strategy.
Chartwell Retirement Residences (CSH) is also actively high-grading their portfolio of retirement homes by looking to sell 10% of existing homes over the next three years with proceeds to be recycled into newer, more efficient, higher growth assets. The company is taking a data-driven approach to deciding which submarkets it should and should not be in based on a series of factors that include senior population growth, employment availability, ethnic composition and competition. CSH has also recently revamped its marketing strategy, switching its focus from building brand awareness towards more targeted interactions with higher conversion rates. We expect these initiatives to yield further gains in portfolio occupancy over the coming years, with a significant percentage of new revenue converting into free cash flow.
Healthcare
Middlefield Fund Tickers & Codes: MHCD / MID 625 / SIH.UN
by Robert Moffat, Portfolio Manager
Healthcare took a breather in September (-1.7%) after two consecutive months of solid outperformance. Defensive areas of the sector, including managed care, pharmaceuticals and distributors led to the downside while more cyclical industries such as life science tools and MedTech outperformed. The Fed’s decision to cut rates by 50 basis points on September 18th acted as a catalyst for risk-on market behaviour and caused profit-taking in defensive sectors, including healthcare.
We expect interest rates will continue to trend lower over the next several quarters. This trend should create powerful tailwinds for the most rate-sensitive areas of the market. Within healthcare, we expect biotechnology to be one of the biggest beneficiaries of this dynamic. Lower borrowing costs benefit the biotech sector in several different ways. Drug development often entails multiple phases of capital raising and lower rates would allow create better access to capital, allowing firms to fund R&D efforts more easily. Drugs in the clinic today are valued on their future earnings potential and are therefore subject to discount rates. Lower discount rates would be supportive of higher valuations for companies that are projected to generate significant growth in the future. Lower rates are also conducive to increased M&A activity as they increase the buying capacity of would-be acquirers.
Our healthcare portfolios are overweight the biotech sector relative to the Benchmark. Our approach to the sector is multi-pronged, balancing upside and growth with risk and volatility mitigation. For example, we have positions in large, diversified biotech companies that have multi-billion-dollar commercial drugs on the market today. These names include Regeneron, AbbVie, Vertex and Gilead – all of which are re-investing their cash flow from commercial products back into their drug pipelines. More recently, we have been adding to some smaller biotech names as well to complement our large-cap positions. Some of the recent additions to the portfolio include Structure Therapeutics and Legend Biotechnology. Structure specializes in developing oral small molecules and has one of the most promising oral GLP-1 drugs in the clinic today. Legend specializes in developing CAR-T cell therapies and is partnered with J&J on its blockbuster multiple myeloma drug, Carvykti. These positions highlight how our actively managed healthcare strategies offer unique exposure to the healthcare sector with an attractive mix of stability and growth.

Infrastructure
Middlefield Fund Tickers & Codes: MINF / MID 265 / MID 510 / ENS / IS / IS.PR.A
by Robert Lauzon, Managing Director & CIO
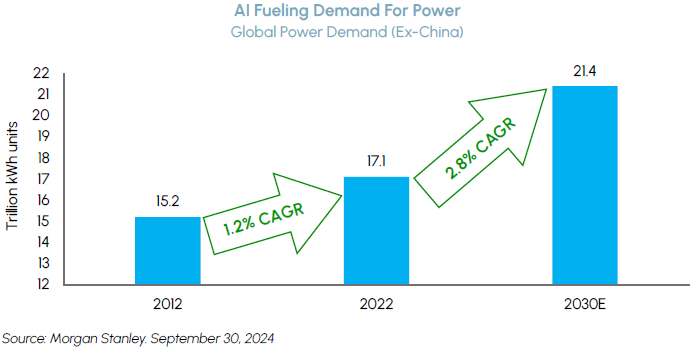
As industries build out their AI capabilities, electricity demand continues to soar. This has caused a tightening in the power market and power price expectations to rise. The Infrastructure Dividend Split Corp. (IS) holds exposure to leading companies across the power supply chain that are poised to benefit from these dynamics including natural gas producers, energy infrastructure and utilities.
 |
Utilities outperformed the S&P 500 and TSX Composite by over 3% during September. Microsoft’s agreement to purchase power from Constellation Energy at a premium and help restart the Three Mile Island nuclear power plant was a landmark transaction that highlights a growing emphasis for energy availability, sustainability, and cost. Nuclear and natural gas are increasingly becoming a viable option for powering the growing number of data centers, supported by favorable policies. As interest rates continue to decline, we anticipate further investments in this area. Blackrock and Microsoft have announced a $30B fund to invest in AI infrastructure, dedicated to data centers and energy projects to address the significant power infrastructure demand.
We recently met with TransAlta’s (TA) management team with the discussion focused on the potential of adding data centers as customers. Although management noted that it is early days for this opportunity, its legacy thermal sites in Alberta could support redevelopment or recontracting to provide “behind the fence” power to data centers. Another catalyst is the significant opportunities that legacy plants represent in their portfolio. For example, the possibility of the conversion from coal-to-gas power at Centralia in Washington State could produce significant value for shareholders.
Technology & Communications
Middlefield Fund Tickers & Codes: MINN / SIH.UN / MID 925 / MDIV
by Shane Obata, Portfolio Manager
The Nasdaq underperformed in Q3, gaining 2.8% vs. the S&P at 5.9%. This was due to a broadening of the market, which we view as a healthy development. While AI remains our highest conviction investment theme, we acknowledge that it is better for the market overall to show strength from a greater number of companies.
This development is also indicative of the broadening out of AI winners within Tech and across other sectors as well. While AI semiconductors have been the main beneficiaries thus far, we are seeing the market ascribe more value to other areas of the supply chain. For example, it is well known that to power the datacenter buildout, the world is going to need a lot more baseload power. As mentioned above, this reality is benefitting gas utilities and nuclear power producers that are focusing on adding capacity to meet demand. Within tech, we expect to see continued progress in terms of software companies monetizing AI and large companies adopting it to improve productivity and reduce costs.
Overall, we think the setup for Tech is highly attractive into year-end. October might bring some near-term volatility but we are expecting a significant rally in Q4, driven by upside guides to AI expenditures, continued robust demand for bleeding-edge chips and potentially a long overdue recovery in non-AI end markets such as PCs and smartphones. We believe investors need to have technology exposure and that Middlefield Innovation ETF (MINN) is an ideal vehicle to capitalize on AI while benefiting from the new era of growing tech dividends.

Resources
Middlefield Fund Tickers & Codes: MID 800 / MID 161 / MID 265 / MRF FT LP / Discovery FT LP
by Dennis da Silva, Senior Portfolio Manager
The price of gold continued to climb to another all-time high above $2,685/oz on rising tensions in the Middle East, China’s stimulus package and the start of Fed rate cuts. Record prices are likely to have a positive effect on cash flow expectations for gold mining companies moving forward. This highlights the attractive operating leverage many gold producers have to gold prices. We expect the recent gradual re-rating in valuations to continue and to attract more capital to gold equities, including juniors, as investors seek greater returns. On the merger and acquisition front, following Goldfields friendly $2.2 billion all-cash offer (67% premium) to acquire Osisko Mining in August, Anglogold Ashanti followed up with its own $3.4 billion offer (37% premium) for Centamin Mining. We continue to advocate that gold is an asset class investors should be paying more attention to. As a financial asset, its importance has grown, recently surpassing the Euro as the second largest reserve currency.
September was a volatile month for energy stocks as the risk of OPEC spare capacity entering the market dampened crude prices. With Saudi Arabia shouldering the majority of the recent production cuts, the Kingdom’s patience with non-compliance by other members such as Iraq and Kazakhstan appears to be wearing thin. These factors weighed on oil sentiment during the month as evidenced by net long positions in WTI and Brent at their lowest levels in 12 years. Even so, we still see plenty of opportunities in the energy sector while it forms a trading base. For example, NYMEX natural gas prices rose 17% in September and WCS differentials have continued to show improvement. Natural gas producers including Tourmaline and Peyto Exploration posted positive returns this month despite the S&P/TSX Capped Energy Index declining 6.3%. Pipelines and energy infrastructure were another bright spot with the sub-industry returning 2.8%. More recently, escalating tensions in the Middle East has caused a sharp upside reversal for oil prices which should result in attractive returns within the energy sector in October.
ESG: Environmental, Social & Governance
Middlefield Fund Tickers & Codes: MDIV / MINF / SIH.UN / MID 265
by Stephen Erlichman, Chair, ESG (Environmental, Social and Governance)
When investors are asked what component of E (environmental) in ESG they first consider to help understand the E risks and opportunities regarding a portfolio investment, often the first answer is climate change. This answer is not surprising, given that it has been seven years since the Task Force on Climate-Related Financial Disclosures (TCFD) released their disclosure framework in 2017, designed to help companies provide better information in order that investors and others could better understand companies’ climate-related risks and opportunities.
However, another key component of E that investors are increasingly considering is nature. In September 2023, the Task Force on Nature-Related Financial Disclosures (TNFD) released their disclosure framework, designed to help companies provide better information in order that investors and others could better understand companies’ nature-related risks and opportunities.
Businesses, either directly or through supply chains, depend in some manner on nature (including clean air and water, productive land and healthy flora and fauna). Businesses not only depend on nature, but also impact nature (including through pollution, resource extraction, and deforestation), thus making the degradation of nature an important financial risk to investors’ portfolios.
How companies interact with nature is a complex area for investors to understand. In September, the Responsible Investment Association of Australia (RIAA) published a Nature Investor Toolkit in order to assist investors in managing their portfolio nature-related opportunities and risks. The RIAA states that the toolkit will provide guidance for investors to 1) identify and assess nature-related risks and opportunities in existing investment portfolios, 2) define and identify new nature-related investment opportunities, and 3) design nature-related focus areas for stewardship, including company engagement, voting and contribution to policy advocacy.
We are at an early stage of the process of having companies make nature-related disclosures based on the TNFD framework. In January 2024, 320 organizations from 45 countries and territories committed to start making such disclosures, while in June 2024 the TNFD announced that an additional 96 organizations made the commitment, resulting in 416 TNFD adopters from 49 jurisdictions around the world. The number of adopters is expected to increase as time goes on, with more TNFD adopters expected to be announced at COP 16 being held in Colombia this month. As additional companies adopt the TNFD framework and provide useful nature-related financial disclosures, investors should be better able to understand nature-related risks and opportunities which in turn should assist investors in their voting decisions and engagements with portfolio holdings.

Exchange Traded Funds (ETFs)
Mutual Funds (FE | F)
TSX-Listed Closed-End Funds
| Fund | Ticker | Strategy |
|---|---|---|
| MINT Income Fund | MID.UN | Equity Income |
| Sustainable Innovation & Health Dividend Fund | SIH.UN | Innovation & Healthcare |
TSX-Listed Split Share Corps. (Class A | Preferred)
| Fund | Ticker | Strategy |
|---|---|---|
| E-Split Corp. | ENS | ENS.PR.A | Energy Infrastructure |
| Real Estate Split Corp. | RS | RS.PR.A | Real Estate |
| Infrastructure Dividend Split Corp. | IS | IS.PR.A | Infrastructure |
LSE-Listed Investment Fund
| Fund | Ticker | Strategy |
|---|---|---|
| Middlefield Canadian Income Trust | MCT | Canadian Equity Income |
Commissions, trailing commissions, management fees and expenses all may be associated with mutual fund investments, including ETFs. Please read the prospectus before investing. You will usually pay brokerage fees to your dealer if you purchase or sell units/shares of investment funds on the Toronto Stock Exchange or other alternative Canadian trading system (an “Exchange”). If the units/shares are purchased or sold on an Exchange, investors may pay more than the current net asset value when buying and may receive less than the current net asset value when selling them. There are ongoing fees and expenses associated with owning units or shares of an investment fund. An investment fund must prepare disclosure documents that contain key information about the fund. You can find more detailed information about the fund in these documents. Mutual funds and investment funds are not guaranteed, their values change frequently and past performance may not be repeated. Certain statements in this disclosure are forward-looking. Forward-looking statements (“FLS”) are statements that are predictive in nature, depend upon or refer to future events or conditions, or that include words such as “may”, “will”, “should”, “could”, “expect”, “anticipate”, “intend”, “plan”, “believe”, or “estimate”, or other similar expressions. Statements that look forward in time or include anything other than historical information are subject to risks and uncertainties, and actual results, actions or events could differ materially from those set forth in the FLS. FLS are not guarantees of future performance and are by their nature based on numerous assumptions. Although the FLS contained herein are based upon what Middlefield Funds and the portfolio manager believe to be reasonable assumptions, neither Middlefield Funds nor the portfolio manager can assure that actual results will be consistent with these FLS. The reader is cautioned to consider the FLS carefully and not to place undue reliance on FLS. Unless required by applicable law, it is not undertaken, and specifically disclaimed that there is any intention or obligation to update or revise FLS, whether as a result of new information, future events or otherwise.
This material has been prepared for informational purposes only without regard to any particular user’s investment objectives or financial situation. This communication constitutes neither a recommendation to enter into a particular transaction nor a representation that any product described herein is suitable or appropriate for you. Investment decisions should be made with guidance from a qualified professional. The opinions contained in this report are solely those of Middlefield Limited (“ML”) and are subject to change without notice. ML makes every effort to ensure that the information has been derived from sources believed to reliable, but we cannot represent that they are complete or accurate. However, ML assumes no responsibility for any losses or damages, whether direct or indirect which arise from the use of this information. ML is under no obligation to update the information contained herein. This document is not to be construed as a solicitation, recommendation or offer to buy or sell any security, financial product or instrument.