

Index
Macro Update
by Dean Orrico, President & CEO and Robert Lauzon, Managing Director & CIO
The S&P 500 delivered its eighth consecutive month of positive total returns in December, resulting in a full-year total return of 17.9%. This marks the third consecutive year of double-digit gains for the Index – a feat that has only been achieved 11 times in the past 100 years. Meanwhile, the TSX Composite generated a total return of 31.7%, representing the sixth best annual return since 1957. Materials and Financials were the biggest contributors to Canadian equity performance with the TSX Banks Industry returning 45.5% and the Metals & Mining Industry returning 115.2%.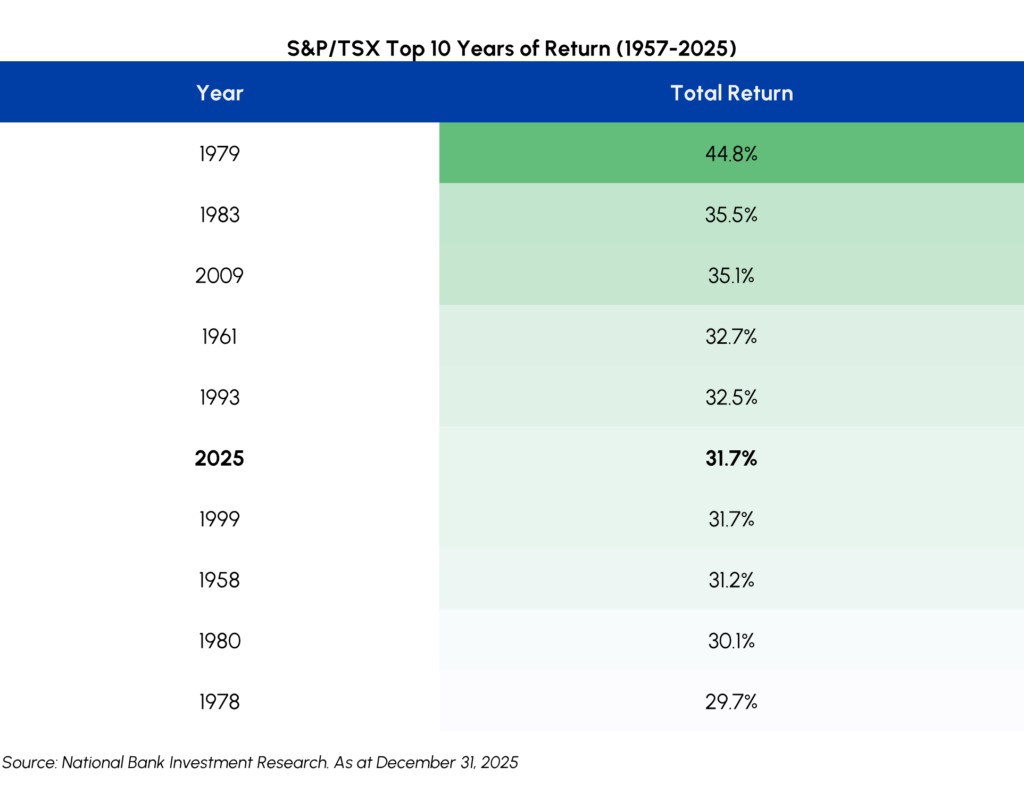 We remain constructive on the outlook for equities in 2026. Similar to last year, our bullish stance is anchored in the durability of earnings growth. Consensus expectations call for both the S&P 500 and the S&P/TSX Composite to deliver double-digit EPS growth over the next two years, supported by a healthy mix of steady topline expansion and continued margin improvement. Importantly, profitability is being structurally enhanced by rising productivity, with a recent Goldman Sachs survey indicating that the share of firms using AI in regular production is expected to increase from 37% today to 74% over the next three years. This acceleration in AI adoption should allow companies to operate more efficiently, driving higher returns on invested capital and equity. Through this lens, we are focused on businesses across both technology and traditional sectors that are already deploying AI in tangible ways to streamline workflows, reduce costs, and expand margins, which we believe will be an important driver of earnings upside.

Further supporting our bullish view is a broadly optimistic macroeconomic backdrop. Consensus forecasts call for global real GDP growth of approximately 2.8% in both 2026 and 2027, providing a supportive environment for economic activity. In Canada, despite widespread growth concerns early in 2025, the growth outlook has improved and the economy now appears likely to skirt a recession. This resilience is being reinforced by fiscal support from the Carney government, a renewed focus on nation-building initiatives, and a consumer that is holding up better than expected – evidenced by Canadian banks broadly reducing provisions for credit losses toward the end of 2025. In the U.S., real GDP growth of roughly 2.5% is expected in 2026, underpinned by tax cuts, deregulation, and easing monetary policy. While we share this constructive view on the U.S. economy, we note that the K-shaped nature of the recovery has become increasingly apparent, with lower-income consumers likely to remain under pressure given constrained borrowing capacity and weaker income growth relative to higher-income cohorts.
One of the most important investment themes in 2026 is likely to be a broadening of market leadership. The AI buildout has resulted in an unusually high concentration of earnings growth among a small group of stocks, most notably the Magnificent Seven. We now expect earnings growth in other areas to improve with the remaining 493 companies in the S&P 500 collectively delivering double-digit EPS growth for the first time in several years. Within this context, we are particularly constructive on sectors that have lagged in recent cycles, including healthcare, real estate, financials, and energy, all of which offer an attractive combination of earnings growth potential and reasonable valuations. More expensive sectors such as Technology and Industrials should also continue to perform, though returns in these sectors are increasingly reliant on sustained earnings delivery given more limited scope for multiple expansion. Our core strategies are well positioned for a broadening market environment, with a continued emphasis on companies that exhibit strong profitability, balance sheet strength and durable free cash flow generation.
Fixed Income
The Bank of Canada (“BoC”) and Federal Reserve (“Fed’) met investor expectations at their December meetings. The BoC did not change its overnight lending rate, staying at 2.25% while emphasizing in-line inflation, employment support, and macro uncertainty, instead of recent economic growth. The Fed cut by 25 basis points (“bps”), down to 3.50-3.75% targets, but guided to a more patient approach going forward. The outlook for future Fed cuts is unclear. The Fed is split between two camps. One is more focused on recent employment weakness and favours multiple cuts, while the other is focused on getting inflation to target and wants to see more progress on that front before further cuts.
Stronger economic data (especially employment) in Canada caused interest rates to rise by 0.2-0.3% across the curve in December. The U.S. saw smaller increases of 0.10-0.15% in key rates. Credit spreads offered by investment grade companies fell from 82 bps to 79 bps while those offered by high yield companies fell from 292 bps to 281 bps. These moves are consistent with an environment where investors are becoming slightly more optimistic about economic and corporate outlooks.
With corporate spreads still near their all-time lows and government bonds yields much lower than their post-COVID highs, we view the risk-reward trade-off in longer-dated corporate bonds as unattractive. We prefer staying shorter in duration, being selective, harvesting coupons, and awaiting better opportunities.
The succession of central bank interest rate cuts have led to a dramatic reduction in yields on cash products. More specifically, the largest high interest saving funds in Canada are currently paying yields in the low 2% range. Investors focused on the preservation of capital are being pressured to accept much lower returns with central banks in an easing cycle. In response to current interest rates and spreads, Middlefield is excited to launch a flexible, multi-sector, short-duration fixed income strategy that will aim to enhance the returns available to low-risk investors while maintaining a focus on liquidity, capital preservation and lower volatility. This new Short Duration Bond Plus strategy will be available in both a mutual fund and ETF format.
Real Estate
Middlefield Fund Tickers & Codes: MREL / MID 600 / RS / RS.PR.A
by Dean Orrico, President & CEO
Real Estate finished 2025 with modest gains, generating total returns of 4.5% in Canada and 3.2% in the U.S. Once again, our real estate strategies handily outperformed their real estate benchmarks with total returns of approximately 12%. Healthcare REITs and Healthcare Facilities were the biggest contributors to outperformance, with notable returns from Extendicare (+108%), Welltower (+43%), Sienna Senior Living (+38%) and Chartwell (+38%). These results underscore the importance of active management in the real estate sector and build upon our longstanding track record of differentiated performance relative to passive benchmarks and peers.
2026 started with a bang in the Canadian REIT sector with another large M&A transaction. On January 5, Minto Apartment REIT announced an agreement to be taken private in a transaction with Crestpoint and Minto Group at a price of $18 per share. Minto owns a high-quality portfolio of urban apartment properties primarily in Toronto, Ottawa and Montreal. The price represents a 32% premium to the previous closing price and an implied cap rate of 5%. Minto is a longstanding core holding across our real estate strategies, and we have been one of the REIT’s largest unitholders for several years. The 32% premium underscores the significant disconnect between public market valuations and the underlying private market value of high-quality Canadian multi-family assets. We view this outcome positively as it provides a strong positive readthrough for the broader apartment sector, reinforcing our view that current valuation discounts across multi-family REITs are excessive.
The Minto transaction comes on the heels of another major announcement in December. Dream Industrial (DIR) announced a $3 billion joint venture with CPP Investments, under which DIR will vend ~$800 million of Canadian industrial assets at an implied cap rate of 4% and a slight premium to IFRS NAV. Management expects low-to-mid single-digit FFO accretion, which could lift 2026 FFO per unit growth into the high-single-digit range, alongside a $100–200 million NCIB and redeployment of remaining proceeds into higher-yielding acquisitions. The transaction strengthens DIR’s balance sheet and adds CPP alongside GIC as a long-term capital partner. Further, it reinforces the disconnect between DIR’s 6.5% implied cap rate and ~20% NAV discount, supporting our view that DIR is well positioned to outperform the REIT sector in 2026.
Healthcare
Middlefield Fund Tickers & Codes: MHCD / MID 325 / SIH.UN
by Robert Moffat, Portfolio Manager
Healthcare staged a remarkable recovery in the second half of 2025 after lagging the broader market by more than 15% at its lowest point. The rebound was concentrated in the biopharma sphere, with the S&P 500 Pharmaceuticals, Life Science Tools & Services and Biotechnology sub-industries generating H2 returns of 31%, 28% and 20%, respectively. The catch-up has been driven by a combination of macro factors (i.e., market rotations and AI-trade hedging) and industry-specific forces including M&A, policy clarity, upward earnings revisions and positive clinical data across multiple therapeutic areas.
Drug pricing overhangs have largely been removed with 14 of 17 pharma companies initially targeted by the Trump Administration’s “Most Favored Nation” campaign announcing deals in recent months. As a result, generalists have re-engaged with the sector and investor attention has re-focused on company fundamentals. The biopharma industry is entering one of the largest patent cliff cycles in history with approximately 35% of 2025 revenues projected to lose patent protection by 2030. This dynamic elevates the importance of new product launches driving topline growth and pipeline catalysts achieving clinical milestones. We will be closely monitoring several new product launches in 2026 including Novo and Lilly’s oral GLP-1 products, Gilead’s long-acting HIV PrEP injection and JNJ’s oral IL-23 immunology product. There are also a multitude of key pipeline catalysts across large therapeutic areas including obesity, oncology, immunology and Alzheimer’s Disease. Overall, we prefer companies with a diversified range of upcoming clinical and commercial catalysts that will position them for sustained earnings growth into the next decade.
The strong performance of stocks in the biopharmaceutical ecosystem has come at the expense of other areas within healthcare. MedTech and Healthcare Services had negative returns in H2 2025 with many quality names experiencing double-digit drawdowns. As a result, Medtech is one of the most attractive areas for GARP investors heading into 2026 with earnings multiples trading below historical ranges. Once again, new product innovations will be key to topline growth and stock performance. We expect cardiovascular devices, surgical robotics and diabetes monitoring to lead in terms of volume growth and are very constructive on our core MedTech names. We remain cautious on Managed Care Organizations as we see potential for operating margins to decline further amidst a robust utilization environment.
Infrastructure
Middlefield Fund Tickers & Codes: MINF / MID 265 / MID 510 / ENS / IS / IS.PR.A
by Robert Lauzon, Managing Director & CIO
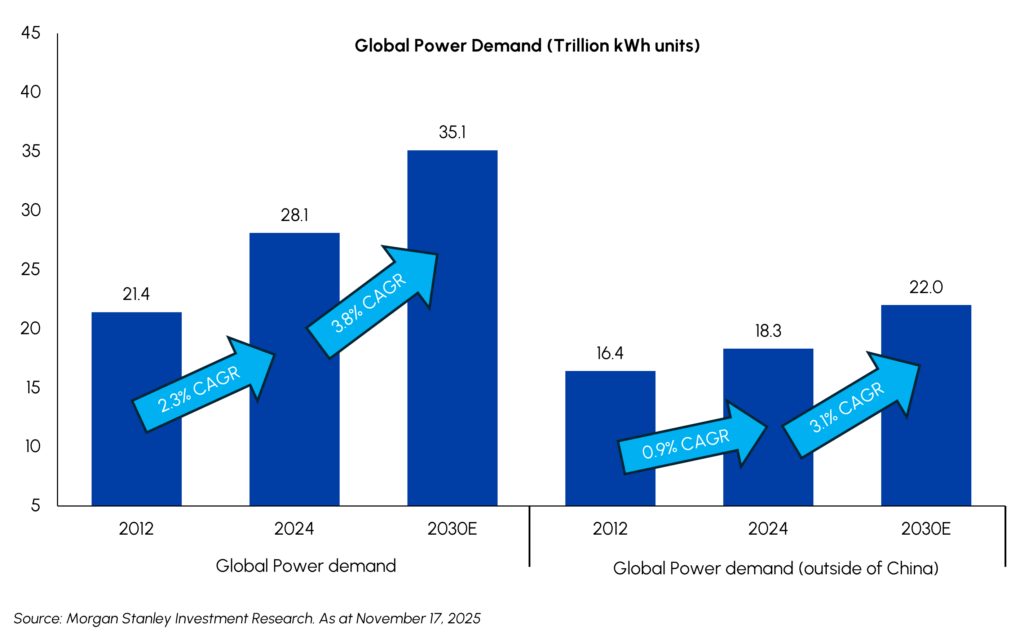
Global power demand is growing at the fastest pace in over two decades, driven primarily by AI power requirements. Global electricity consumption is expected to grow at a 3.8% CAGR with more than 120 GW of incremental data center power demand forecast globally between 2025 and 2028. As this demand intensifies over short development timelines, power availability and delivery have emerged as the binding constraints shaping AI deployment. The result is a rapid shift in investment toward infrastructure that can secure reliable, high-density power at scale.
The AI buildout is increasingly reshaping infrastructure investment across the full power stack. Rack densities that averaged 10–20 kW historically have moved toward 50–200 kW in current AI deployments, with next-generation systems targeting ~1 MW per rack as architectures shift toward direct-current data centers. This is increasing requirements for firm generation, transmission capacity, and advanced electrical and thermal systems, providing further runway for the AI infrastructure buildout. As deployment timelines compress, capital continues to move toward assets that can deliver reliable power at speed, favoring utilities, power producers, and integrated platforms with permitting expertise and supply-chain depth.
Canada is increasingly positioned as a beneficiary of this global AI infrastructure cycle as hyperscalers expand capacity closer to reliable, policy-aligned power systems. In December, Microsoft announced a $7.5B investment in Canada over the next two years, part of a broader ~$19B commitment through 2027. Recent transmission and interconnection approvals for large-scale solar and storage projects in Alberta underscore how incremental generation and grid investment are beginning to align with anticipated AI-driven load growth. This is positive for Canadian infrastructure developers as investment-grade counterparties increasingly underpin multi-year demand profiles. With execution accelerating into 2026, Canada’s stable regulatory framework and established energy systems support sustained participation in the global AI infrastructure buildout.
Technology & Communications
Middlefield Fund Tickers & Codes: MINN / SIH.UN / MID 925 / MDIV
by Shane Obata, Portfolio Manager
As we enter 2026, the case for maintaining a broad overweight exposure to Technology remains anchored in superior earnings durability. In a macroeconomic environment defined by mixed signals, the sector continues to offer the most reliable path to >20% EPS growth. However, the mechanism of stock performance is evolving. In 2026, we think alpha will likely be driven less by multiple expansion and more by the magnitude of positive earnings revisions. We believe the market will increasingly reward companies that can demonstrate operating leverage and pricing power, distinguishing themselves from those merely riding the thematic wave.
We are seeing this revision cycle emerge most clearly in the memory and storage markets. While the narrative has long focused on High Bandwidth Memory (HBM) shortages for AI accelerators, broader price increases are taking hold across commodity DRAM and NAND. Supply discipline among major manufacturers, coupled with a nascent upgrade cycle in traditional servers, is driving analysts to revise revenue and margin expectations upward for the first half of the year. This positive momentum is creating a halo effect for adjacent industries, particularly semiconductor capital equipment and testing, where order books are firming up to support the complex manufacturing requirements of next-generation silicon.
Despite these robust fundamentals, investors should expect the broader market to move in fits and starts. The trajectory of the global AI buildout is as strong as ever, but stock performance will likely be non-linear as the market digests the sheer scale of capital deployment. We view periods of volatility not as warning signs, but as entry points into high-conviction themes. Chief among these is power infrastructure; as the energy bottleneck tightens, we are using weakness to build positions in the electrical supply chain essential to keeping the AI economy running.
Simultaneously, as model sizes expand, the bottleneck shifts from the chip to the interconnect, creating opportunities in networking companies that facilitate high-speed data transfer. Finally, we are looking beyond infrastructure to the interactive entertainment sector. Often overlooked in the initial AI trade, video games are entering a robust product cycle. With major franchise releases on the horizon and the integration of generative AI tools beginning to streamline ballooning development costs, the risk-reward profile for publishers looks increasingly attractive. By following the earnings revisions and opportunistically adding to these critical verticals, we believe the portfolio is well-positioned for the year ahead.

Resources
Middlefield Fund Tickers & Codes: MID 800 / MID 161 / MID 265 / MRF FT LP / Discovery FT LP
by Dennis da Silva, Senior Portfolio Manager
Gold hit multiple all-time highs during December, peaking at over US$4,500 per ounce. For full-year 2025, gold delivered a return of approximately 64%, its best year since 1979. Gold is in its longest winning streak since the run-up to all-time highs in October, with holdings in gold-backed ETFs rising every month this year except May, according to the World Gold Council. Precious metals closed out the year and began in January with extraordinary momentum as well, underscoring a broader shift in global investment sentiment toward safety, scarcity, and real assets. While equity markets remain resilient, the surge in hard assets suggests investors are quietly hedging against volatility, policy risk, and currency erosion. Barrick Mining remained in the spotlight after announcing that it is evaluating an IPO of a minority interest in its North American gold assets. More details are expected in February.
While gold was reaching historic highs, the energy sector faced a different reality. Despite tensions in the Middle East, Russian oil sanctions and more geopolitical risk building in Latin America, the oil market continues to be weighed by a narrative of significant supply surplus. Adding to this pressure, markets began bracing for volatility following U.S. military actions against the Maduro government; while the immediate price reaction was muted due to existing oversupply, analysts began debating whether a “Marshall Plan” for Venezuelan oil would eventually depress global prices. This dynamic has created an uncertain environment for both risk and cash flow deployment.
Natural gas experienced significant volatility as well, hitting three-year highs on a deep cold snap in early December but falling later in the month as forecasts shifted milder, with spot prices declining more than 25% from those highs. Despite domestic price swings, the U.S. solidified its role as a global energy titan, ending 2025 as the first country to export more than 100 million metric tons of LNG in a single year. The S&P/TSX Capped Energy Index was down 2.4% in December, largely on the back of the 24.0% decline in natural gas.
Exchange Traded Funds (ETFs)
Mutual Funds (FE | F)
TSX-Listed Closed-End Funds
| Fund | Ticker | Strategy |
|---|---|---|
| MINT Income Fund | MID.UN | Equity Income |
| Sustainable Innovation & Health Dividend Fund | SIH.UN | Innovation & Healthcare |
TSX-Listed Split Share Corps. (Class A | Preferred)
| Fund | Ticker | Strategy |
|---|---|---|
| E-Split Corp. | ENS | ENS.PR.A | Energy Infrastructure |
| Real Estate Split Corp. | RS | RS.PR.A | Real Estate |
| Infrastructure Dividend Split Corp. | IS | IS.PR.A | Infrastructure |
LSE-Listed Fund
| Fund | Ticker | Strategy |
|---|---|---|
| Middlefield Canadian Enhanced Income UCITS ETF | LSE: MCTC | LSE: MCTP | Canadian Equity Income |
Commissions, trailing commissions, management fees and expenses all may be associated with mutual fund investments, including ETFs. Please read the prospectus before investing. You will usually pay brokerage fees to your dealer if you purchase or sell units/shares of investment funds on the Toronto Stock Exchange or other alternative Canadian trading system (an “Exchange”). If the units/shares are purchased or sold on an Exchange, investors may pay more than the current net asset value when buying and may receive less than the current net asset value when selling them. There are ongoing fees and expenses associated with owning units or shares of an investment fund. An investment fund must prepare disclosure documents that contain key information about the fund. You can find more detailed information about the fund in these documents. Mutual funds and investment funds are not guaranteed, their values change frequently and past performance may not be repeated. Certain statements in this disclosure are forward-looking. Forward-looking statements (“FLS”) are statements that are predictive in nature, depend upon or refer to future events or conditions, or that include words such as “may”, “will”, “should”, “could”, “expect”, “anticipate”, “intend”, “plan”, “believe”, or “estimate”, or other similar expressions. Statements that look forward in time or include anything other than historical information are subject to risks and uncertainties, and actual results, actions or events could differ materially from those set forth in the FLS. FLS are not guarantees of future performance and are by their nature based on numerous assumptions. Although the FLS contained herein are based upon what Middlefield Funds and the portfolio manager believe to be reasonable assumptions, neither Middlefield Funds nor the portfolio manager can assure that actual results will be consistent with these FLS. The reader is cautioned to consider the FLS carefully and not to place undue reliance on FLS. Unless required by applicable law, it is not undertaken, and specifically disclaimed that there is any intention or obligation to update or revise FLS, whether as a result of new information, future events or otherwise.
This material has been prepared for informational purposes only without regard to any particular user’s investment objectives or financial situation. This communication constitutes neither a recommendation to enter into a particular transaction nor a representation that any product described herein is suitable or appropriate for you. Investment decisions should be made with guidance from a qualified professional. The opinions contained in this report are solely those of Middlefield Limited (“ML”) and are subject to change without notice. ML makes every effort to ensure that the information has been derived from sources believed to reliable, but we cannot represent that they are complete or accurate. However, ML assumes no responsibility for any losses or damages, whether direct or indirect which arise from the use of this information. ML is under no obligation to update the information contained herein. This document is not to be construed as a solicitation, recommendation or offer to buy or sell any security, financial product or instrument.


