

Index
Macro Update
by Dean Orrico, President & CEO and Robert Lauzon, Managing Director & CIO
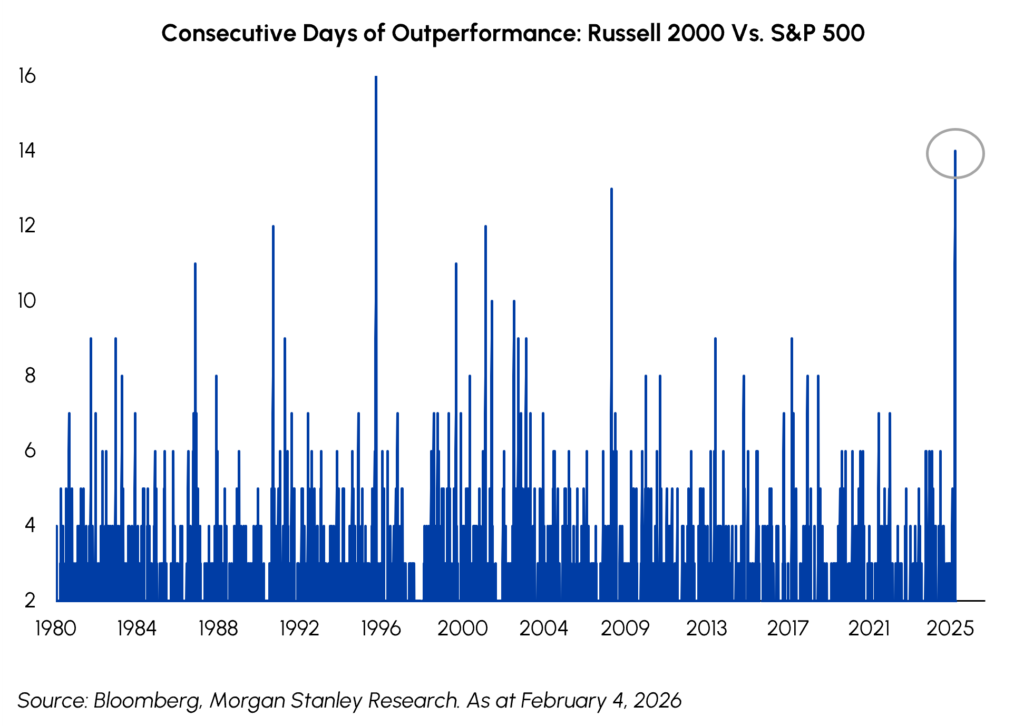
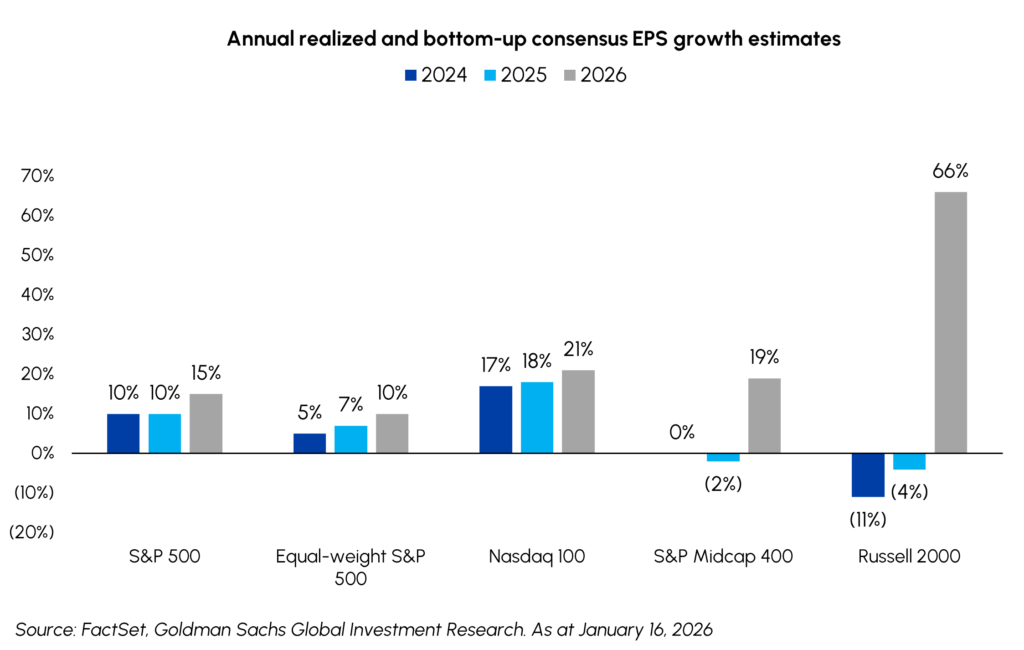
During January, the TSX was up 0.8% while the S&P 500 generated a respectable 1.4% return, with 7 of the 11 S&P 500 sectors outperforming the Index. Resource sectors led the way with Energy up 14.4% and Materials up 8.7% amidst rising commodity prices. The market broadening theme we predicted at the start of the year has already started to play out in a meaningful way. More notable is the rotation into small and mid-cap stocks. The Russell 2000 generated a total return of 5.4% this month and included a 14–day streak of outperformance relative to the S&P 500 – the longest stretch dating back to 2016. While investors have rightly been focused on the AI boom for several quarters, we are now seeing encouraging signs of improving sentiment in other areas. We think the current setup has structural underpinnings of a sustained rally in ‘Non-Megacaps’ aided by monetary and fiscal stimulus, easing financial conditions, increasing M&A and accelerating earnings momentum.
Similar to the Russell, global indices also outperformed the S&P 500 in January. Major indices in Europe (+2.8%), Japan (+5.9%) and Hong Kong (+6.9%) all outperformed the U.S. This pattern further supports our view that we are in the early stages of a longer-term market broadening trend after several years of concentrated market leadership. Global investors are being presented with more investment opportunities than years prior in markets where valuations and positioning are much more favourable. This environment is ideal for Middlefield’s diversified global strategies which have exposure to several developed markets that have lagged the U.S. in recent years.
Despite briefly rattling markets, President Trump’s latest tariff threats related to Greenland were quickly faded as investors reverted to the familiar “TACO” playbook of buying the dip. The market’s resilience underscores a growing market desensitization to tariff headlines, so long as U.S. economic fundamentals remain intact. This response is supported by recent analysis showing that of 49 tariff threats or trade investigations announced since late 2024, only about 25% have been fully implemented, while roughly 43% were either withdrawn or never imposed, with the remainder stalled in investigation or partially enacted. We are seeing a trend where the most aggressive proposals, particularly those that would raise effective U.S. tariffs or disrupt major trade relationships, tend to be scaled back, helping explain why investors increasingly discount the volatility and headline risk surrounding trade rhetoric. Our focus remains on earnings fundamentals which continue to support higher stock prices in the months ahead.
Prime Minister Mark Carney is taking a different stance with regards to trade threats, highlighted by his bold speech at Davos. Days before, the Prime Minister announced a new trade pact with China, signaling the need for diversification as renewed tariff threats and policy volatility disrupt long-standing alignment. The agreement, which allows up to 49,000 Chinese EVs into Canada at low tariffs and enables joint-venture auto investments, would have been unlikely prior to Trump’s return and reflects a deliberate effort to reduce reliance on the U.S., which still accounts for roughly 70% of Canadian exports. President Trump responded to the announcement by threatening 100% tariffs on Canadian goods, though such measures are widely viewed as unlikely to be implemented. Regardless of how the Canada / U.S. trade relationship evolves, we agree we agree with the notion that Canada must strengthen its trade partnerships abroad. We view these developments positively as they open new opportunities for Canadian exports.
Fixed Income
In response to current interest rates and spreads, Middlefield is excited to launch a flexible, multi-sector, short-duration fixed income strategy that will aim to enhance the returns available to low-risk investors while maintaining a focus on liquidity, capital preservation and lower volatility. This new Short Duration Bond Plus strategy is now available in both a mutual fund and ETF format.
The most important event in fixed income happened near the end of the month when President Trump confirmed his selection of Kevin Warsh as the new head of the Federal Reserve (“Fed”). Investors are still trying to reconcile Warsh’s previous hawkish bias with President Trump’s desire for lower interest rates. The Federal Open Market Committee and Bank of Canada (“BoC”) rate decisions were mostly non-events. Both emphasized their comfort with the current rate level and data dependence going forward. The Fed removed its reference to the downside risks to employment, adding a little doubt about future rate cuts. The BoC continued to emphasize uncertainty over any recent strength in economic data. Interest rate curves were little changed in Canada and the US in January, with no tenor of the curve changing more than 10 basis points.
Credit spreads narrowed to some of tightest levels seen on record. Investment grade credit indices only offer 0.7-0.8% more than government bonds, and high yield indices provide approximately 2.5% of spread.
Real Estate
Middlefield Fund Tickers & Codes: MREL / MID 600 / RS / RS.PR.A
by Dean Orrico, President & CEO
Real Estate had a strong start to 2026, with the sector outperforming in both Canada and the US. Our real estate mandates fared even better during January, with MREL gaining 3.7% vs the Canadian Real Estate sector at 1.4%.
The backdrop for office REITs is beginning to improve, with early signs of stabilization emerging in select, high-quality markets. In Canada, vacancy appears to be inflecting after several years of deterioration, with national downtown office vacancy declining by 50 basis points in Q4. This marks the second consecutive quarterly improvement and the largest quarter-over-quarter decline since 2011, suggesting peak vacancy may now be behind us. The U.S. office market is also showing pockets of strength, particularly in New York City. According to CBRE, Q4 Manhattan leasing activity increased 30% year-over-year, reflecting healthy tenant demand from financial services and technology companies. Against this backdrop, we have selectively increased exposure to the office sector through a recently initiated position in SL Green, a pure-play New York City office REIT trading at a steep discount to net asset value. With a concentrated portfolio of well-located, high-quality assets, SL Green is well positioned to benefit from improving leasing momentum as large tenants increase their footprints in a tight rental market.
The industrial real estate market is also showing signs of stabilization, a trend highlighted by a recent update from Granite REIT (GRT), a long-standing core holding in our real estate portfolios. GRT reported new leasing activity that lifted portfolio occupancy to 98%, an increase of 120 basis points quarter-over-quarter. Occupancy has been the most closely watched metric for GRT amid un-leased new developments, making this a particularly encouraging data point. The company also announced $190 million of asset dispositions alongside $256 million of acquisitions at a stabilized cap rate of approximately 6%. This capital recycling strategy supports GRT’s ongoing portfolio upgrade, enhances asset quality, and positions the REIT to capture future rental growth as industrial fundamentals continue to strengthen.
In January, Minto Apartment REIT announced it would be acquired by Minto Group and Crestpoint Real Estate Investments at $18.00 per unit, a 35% premium to the 20-day VWAP. Middlefield was one of Minto’s largest shareholders with a 4% average weighting across our real estate funds and additional exposure in diversified portfolios. Minto has been a high-conviction holding for many years despite sector headwinds from condo oversupply and slower Canadian immigration. The deal validates our long-held view that the units were trading at an unsustainable discount to intrinsic value. Its exclusion from the XRE index further underscores our willingness to deviate from benchmarks where we see compelling value. This transaction, alongside GIC’s announced acquisition of InterRent, highlights strong private-market demand for high-quality multi-family assets with durable cash flows and reinforces our view that undervalued public real estate platforms should proactively pursue value-realization strategies.
Healthcare
Middlefield Fund Tickers & Codes: MHCD / MID 325 / SIH.UN
by Robert Moffat, Portfolio Manager
The healthcare sector began the year with the annual J.P. Morgan Healthcare Conference in San Francisco, featuring more than 500 companies across the sector. Discussions spanned product innovation, pipeline development, capital allocation, M&A, and the expanding role of AI. Notably, the tone at this year’s conference was decidedly more upbeat than in recent years, with a meaningful increase in attendance and engagement from generalist investors — a signal that interest in the sector is broadening after a prolonged period of underperformance.
A key takeaway from JPM was a clear shift in focus away from policy risk and toward underlying fundamentals. After a year dominated by uncertainty around drug pricing reform and tariff-related overhangs, management teams emphasized improving earnings visibility, balance sheet strength, and organic growth opportunities. In biopharma, several of our core holdings provided updates pointing to improving pipeline depth and productivity, reinforcing our confidence in the sector’s long-term growth outlook, particularly as the industry approaches a significant patent cliff over the next several years. In MedTech, management commentary confirmed that procedure volumes remain robust and pricing trends are stable, a view supported by multiple companies that pre-announced strong Q4 results and expressed optimism heading into 2026. With valuations still very reasonable, MedTech continues to offer an attractive combination of defensive growth and quality characteristics, and we remain overweight this segment. Life science tools and diagnostics also emerged as an area of renewed positive sentiment, with companies citing an improving demand environment from biopharma customers following several years of sluggish activity. We expect this recovery to translate into an earnings inflection in 2026 and a gradual return toward historical growth rates.
Investor enthusiasm was tempered late in January when CMS announced the Medicare Advantage advance rate notice. Consensus expectations had centered on a 4–6% increase, and the final rate came in close to flat, implying a meaningfully lighter revenue envelope for plan administrators than anticipated. This is particularly challenging given elevated medical cost trends that have persisted since late 2022 and creates renewed margin pressure for managed care organizations. In response, plan administrators are likely to pull familiar levers to protect profitability, including benefit reductions, premium increases, tighter utilization management, narrower provider networks, and selective participation in competitive bidding markets. The investment case for companies like UnitedHealth Group now rests on their ability to offset pricing headwinds through aggressive cost management and portfolio optimization. While we continue to believe UNH can compound meaningfully over a multi-year horizon, the recent rate announcement increases the risk of several more quarters of choppy earnings. We remain underweight the Managed Care segment and see better opportunities across Biopharma, MedTech and Life Science Tools & Services.
Infrastructure
Middlefield Fund Tickers & Codes: MINF / MID 265 / MID 510 / ENS / IS / IS.PR.A
by Robert Lauzon, Managing Director & CIO
Despite ongoing geopolitical uncertainty and sharp commodity price swings, Canadian energy infrastructure continues to demonstrate resilience, with midstream and pipeline peers delivering steady performance. Broad market flows have rotated away from highly valued momentum equities into cash-flow-generative energy infrastructure, where many names are trading near 52-week highs. Management teams across the industry typically have ~90% of free cash flow secured under long-term take-or-pay contracts, supporting stable returns and enabling increased distributions and buybacks. AltaGas highlighted continued execution across its midstream backlog, bringing Pipestone II online and advancing additional growth opportunities toward FID, underscoring the sector’s operational momentum and investor support.
Independent power producers and renewable utilities also remain in focus as affordability and regulatory dynamics evolve, particularly around U.S. wholesale power markets such as PJM. Capital Power emphasized that its near-term cash flow remains insulated by existing hedges and stable forward prices, while strong recontracting and uprate opportunities support its confidence in exceeding its 8–10% AFFO/share growth target through optimization initiatives. Meanwhile, Brookfield Renewable’s recent 2025 results showed robust growth in core metrics, with FFO per unit up ~10% and a 5% distribution increase, reflecting strength in its Hydro portfolio and notable growth across solar and battery segments, verticals management continues to prioritize alongside long-duration power purchase agreements that enhance long-term cash flow visibility.
Technology & Communications
Middlefield Fund Tickers & Codes: MINN / SIH.UN / MID 925 / MDIV
by Shane Obata, Portfolio Manager
The central pillar supporting the Technology sector remains earnings power compared to the broader market. While the S&P 500 ex-technology has improved, Tech remains the primary engine of corporate profits. This superior earnings profile is the critical factor justifying current valuations; investors are paying a premium not just for potential, but for the tangible delivery of higher earnings growth.
However, treating “Technology” as a monolith has become increasingly dangerous. Navigating the sector in 2026 requires a high degree of precision, as we are witnessing simultaneous, opposing cycles: a roaring bull market in memory & storage, juxtaposed against a punishing bear market in software. This historic dispersion creates a complex environment for passive allocation but offers a rich opportunity set for active managers capable of distinguishing between cyclical winners and structural losers.
While the AI infrastructure buildout continues unabated, providing a tailwind for the picks and shovels, the software sub-sector faces an existential reckoning. The recent sell-off in software names has been extreme and, in many cases, likely overshoots the immediate financial impact. However, the market’s trepidation is rooted in a valid appreciation of narrative and headline risk. The pace of innovation emerging from major AI labs is not slowing; it is accelerating. Every new model release introduces a “shock” that forces investors to reassess the moats of legacy SaaS applications.
Consequently, while valuations look attractive relative to history, we believe investors must adjust their framework for the industry. The traditional “seat-based” revenue model—charging per human user—faces long-term pressure as AI agents increasingly automate workflows. Until software companies successfully transition to consumption-based or outcome-based pricing models, the threat of deflationary AI hangs over the sector. Because of this disruption risk, we are cautious about assuming valuation mean reversion. It is prudent to assume that terminal multiples for traditional software may be permanently lower than historical averages. Therefore, despite the sell-off, we remain selective.

Resources
Middlefield Fund Tickers & Codes: MID 800 / MID 161 / MID 265 / MRF FT LP / Discovery FT LP
by Dennis da Silva, Senior Portfolio Manager
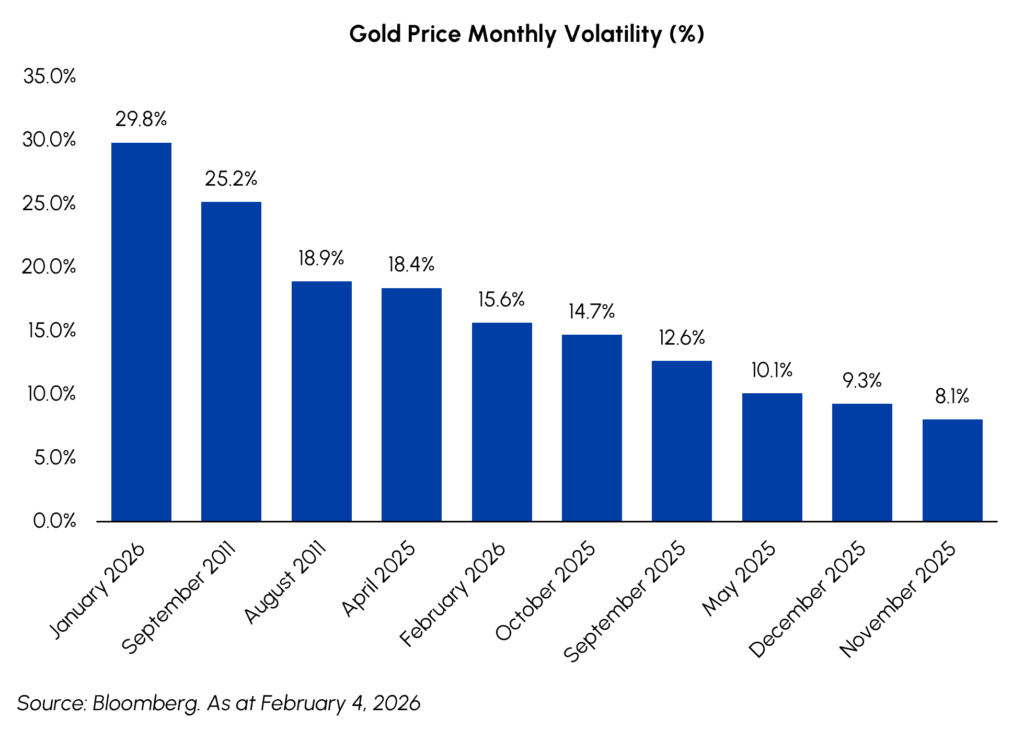
The 13% increase in gold bullion was an impressive move for a single month, but that is not reflective of the volatility the metal experienced during late January. Most of the month gold acted as a relentless haven in a market spooked by geopolitical tensions, and intense “debasement” trading resulting in consistent inflows into gold-backed ETFs, sending the gold price to an all-time high near US$5,600/oz. On January 30, the market experienced a stunning reversal, as gold collapsed 10%, the largest single-day decline in decades. What started as month-end profit taking, was exacerbated by strength in the US dollar following the nomination of Kevin Warsh as Fed chair, and liquidations associated with increasing futures margin requirements. What started as month-end profit taking, was exacerbated by strength in the US dollar following the nomination of Kevin Warsh as Fed chair, and liquidations associated with increased futures margin requirements. To put the decline in perspective, over the past 25 years, gold’s price has changed on average by 0.8% per day. We see this as removing some of the ‘speculative froth’ that has gripped the gold market in recent weeks. Zooming out, gold bullion retraced only the prior six trading days, leaving the market in a state of high volatility, yet fundamentally supported, consolidation.
We used the melt-up in January to liquidate a portion of our gold positions. Despite the volatility, long-term demand tailwinds from central banks and institutional portfolio diversification persists. The pullback in gold and gold equities should be viewed as a opportunistic, allowing us to deploy capital for our MRF 2026 flow-through fund before gold resumes its move towards our expectation of US$6,000/oz in the second half of 2026. Producing gold miners are generating historic margins and operating with pristine balance sheets enabling share buybacks. At US$5,000/oz gold, the average producer is adding approximately US$2,500 of cash to the balance sheet for every ounce produced. Current margins are equal to where the gold price was in the summer of 2024!! Bullion and the related equities significantly outperformed broad North American markets in January with gold up 12.8% while the S&P/TSX Gold equity index gained 9.3%.
Turning to energy, geopolitics remained the driving narrative as Venezuela, protests in Iran, and Russia/Ukraine controlled the headlines. Initially, U.S. rhetoric to revive Venezuelan production added a layer of psychological pressure on heavy crude markets, even as experts warned that the country’s decaying infrastructure would require billions in investment to make a meaningful impact. The narrative shifted through the month to increasing Iran risk, with oil prices steadily increasing to reflect the upside we had observed in prior supply shock “risk-on” rallies. As was the case with gold, the month end natural gas price masked the historic volatility of the commodity during the month as a major cold front swept across most major production regions, taking over 10% of production offline. This sudden supply pinch, paired with a spike in heating demand, doubled Henry Hub prices to 3-year highs. The S&P/TSX Capped Energy Index was up 11.2% in January, thanks to impressive gains in the underlying commodities of 18.1% (natural gas) and 13.6% (WTI) in addition to institutional fund flows into the sector.
Exchange Traded Funds (ETFs)
Mutual Funds (FE | F)
TSX-Listed Closed-End Funds
| Fund | Ticker | Strategy |
|---|---|---|
| MINT Income Fund | MID.UN | Equity Income |
| Sustainable Innovation & Health Dividend Fund | SIH.UN | Innovation & Healthcare |
TSX-Listed Split Share Corps. (Class A | Preferred)
| Fund | Ticker | Strategy |
|---|---|---|
| E-Split Corp. | ENS | ENS.PR.A | Energy Infrastructure |
| Real Estate Split Corp. | RS | RS.PR.A | Real Estate |
| Infrastructure Dividend Split Corp. | IS | IS.PR.A | Infrastructure |
LSE-Listed Fund
| Fund | Ticker | Strategy |
|---|---|---|
| Middlefield Canadian Enhanced Income UCITS ETF | LSE: MCTC | LSE: MCTP | Canadian Equity Income |
Commissions, trailing commissions, management fees and expenses all may be associated with mutual fund investments, including ETFs. Please read the prospectus before investing. You will usually pay brokerage fees to your dealer if you purchase or sell units/shares of investment funds on the Toronto Stock Exchange or other alternative Canadian trading system (an “Exchange”). If the units/shares are purchased or sold on an Exchange, investors may pay more than the current net asset value when buying and may receive less than the current net asset value when selling them. There are ongoing fees and expenses associated with owning units or shares of an investment fund. An investment fund must prepare disclosure documents that contain key information about the fund. You can find more detailed information about the fund in these documents. Mutual funds and investment funds are not guaranteed, their values change frequently and past performance may not be repeated. Certain statements in this disclosure are forward-looking. Forward-looking statements (“FLS”) are statements that are predictive in nature, depend upon or refer to future events or conditions, or that include words such as “may”, “will”, “should”, “could”, “expect”, “anticipate”, “intend”, “plan”, “believe”, or “estimate”, or other similar expressions. Statements that look forward in time or include anything other than historical information are subject to risks and uncertainties, and actual results, actions or events could differ materially from those set forth in the FLS. FLS are not guarantees of future performance and are by their nature based on numerous assumptions. Although the FLS contained herein are based upon what Middlefield Funds and the portfolio manager believe to be reasonable assumptions, neither Middlefield Funds nor the portfolio manager can assure that actual results will be consistent with these FLS. The reader is cautioned to consider the FLS carefully and not to place undue reliance on FLS. Unless required by applicable law, it is not undertaken, and specifically disclaimed that there is any intention or obligation to update or revise FLS, whether as a result of new information, future events or otherwise.
This material has been prepared for informational purposes only without regard to any particular user’s investment objectives or financial situation. This communication constitutes neither a recommendation to enter into a particular transaction nor a representation that any product described herein is suitable or appropriate for you. Investment decisions should be made with guidance from a qualified professional. The opinions contained in this report are solely those of Middlefield Limited (“ML”) and are subject to change without notice. ML makes every effort to ensure that the information has been derived from sources believed to reliable, but we cannot represent that they are complete or accurate. However, ML assumes no responsibility for any losses or damages, whether direct or indirect which arise from the use of this information. ML is under no obligation to update the information contained herein. This document is not to be construed as a solicitation, recommendation or offer to buy or sell any security, financial product or instrument.


