

Index
Middlefield is pleased to announce that it has been recognized as an LSEG Lipper Fund Awards Canada 2025 Winner for the exceptional performance of two of its core mutual fund strategies: Middlefield Real Estate Dividend Class and Middlefield U.S. Equity Dividend Class. These industry-leading awards highlight the funds’ consistent ability to deliver strong, risk-adjusted performance relative to peers. Middlefield Real Estate Dividend Class Series F was awarded Best Real Estate Equity Fund over three and five years, while Middlefield U.S. Equity Dividend Class Series F received the Best U.S. Dividend & Equity Income Fund award over three years.

Macro Update
by Dean Orrico, President & CEO and Robert Lauzon, Managing Director & CIO
Markets continued to make new highs into the month end as the bull market in equities remains intact. The S&P 500 and the TSX Composite returned 2.3% and 1% in October, respectively, marking the sixth consecutive positive monthly return for the major indices. The TSX maintains its leadership on a year-to-date basis with a total return of 25.2%, outpacing the S&P 500 return of 17.5% and the NASDAQ Composite return of 23.5%.
There are several factors supporting the recent rally in equities, including easing monetary policy, deregulation of financial markets, resilience of consumer spending and the AI capex cycle. We are now seeing these tailwinds reflected in earnings with the Q3 reporting season tracking as one of the strongest on record. More than 70% of S&P 500 companies have reported quarterly results with an average EPS growth rate of 11.6% year-over-year. Importantly, companies are exceeding estimates by more than 10% on average, with 64% of companies beating consensus EPS forecasts by at least one standard deviation. This frequency of earnings surprises is the highest since the COVID reopening period and among the largest in 25 years. Topline growth is making a notable impact, with year-over-year sales growth tracking above 8% and 52% of companies beating consensus sales estimates compared to a long-term average of 37%. We have been consistent in our view that earnings growth can support elevated valuations and that equities have further upside throughout 2026 if such robust fundamentals persist.
The Liberal government unveiled its highly anticipated federal budget on November 5 and it was viewed positively by investors. The government announced billions of dollars in new investments aimed at boosting economic growth, tax relief measures, and a renewed commitment to right-sizing its operations by reducing the federal workforce by nearly 40,000 people. Although the fiscal deficit is set to widen, we see no meaningful risk to Canada’s fiscal stability as deficit ratios are in-line with prior periods and Canada’s net debt to GDP remains the lowest in the G7. Importantly, the composition of spending is shifting away from operating and social expenditures toward capital projects and long-term infrastructure initiatives. This pivot should support a broad swath of the Canadian economy, including REITs, utilities, resources, industrials, and technology. Financials also stand to benefit as private sector demand for financing rises in response to the government’s stimulus efforts.
As we highlighted, multiple fundamental tailwinds have been driving markets higher this year. Technical factors may join that list soon as we enter the strongest period of the year from a seasonality perspective. Historically, November has been the best month of the year for Canadian equities, with the TSX Composite posting an average return of 1.9% and finishing higher 67% of the time. The trend has been even stronger over the past decade, with an average gain of 3.3%. The S&P 500 shows the same pattern. Since 1950, November has delivered an average return of 1.9% and positive performance 69% of the time, rising to 4.1% on average over the past 10 years. The November-to-January period also represents the strongest three-month stretch of the year, with average gains of 4.3% for both the S&P 500 and S&P/TSX Composite. While short-term pullbacks are inevitable, the strength of these seasonal tailwinds suggests the broader uptrend should remain intact through the end of the year and into 2026.
Real Estate
Middlefield Fund Tickers & Codes: MREL / MID 600 / RS / RS.PR.A
by Dean Orrico, President & CEO
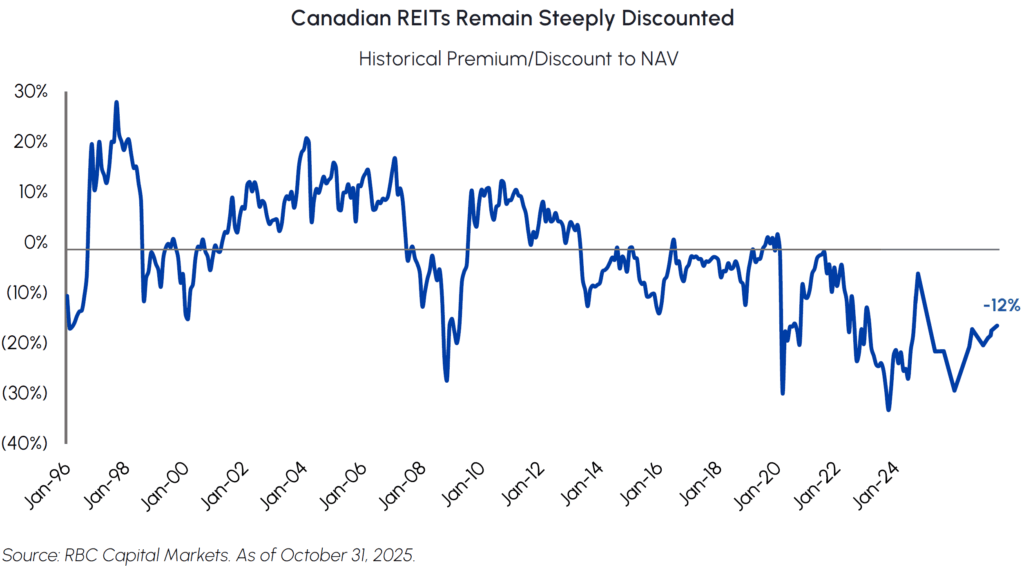
Canadian REITs have outpaced U.S. REITs in 2025. Year-to-date, Middlefield Real Estate Dividend ETF has returned 11.1% compared to the S&P 500 Real Estate Index total return of 3.4%. Active management in the REIT sector remains critical as subsectors with the real estate market behave very differently. The solid performance of our real estate strategies also highlights the positive fundamentals underpinning various segments of the commercial real estate sector versus the currently depressed status of condominium markets in major cities like Toronto and Vancouver. As a result, publicly listed REITs focused on commercial real estate have proven to be excellent diversifiers for both institutional as well as individual investors. We have also maintained overweight exposure to Canadian REITs in our diversified income strategies in 2025 based on current attractive valuations, declining interest rates, increasing funds flows and the corresponding positive re-rating potential in the sector over the next twelve months. See below for the current discount to NAV for the Canadian REIT sector.
Healthcare real estate remains one of our preferred asset classes and has been a significant contributor to performance this year. Chartwell continues to execute on its growth strategy by expanding its presence in high-demand markets. The company recently announced the acquisition of three newly built, amenity-rich residences in Quebec. These additions bring Chartwell’s total regional investment to roughly $1.6 billion and position the REIT to capture further upside as market rents accelerate and lease incentives roll off on unit turnover. Recent data from Cushman & Wakefield highlight Quebec’s relative outperformance, with Montreal and Quebec City leading the country in both occupancy and rent growth for one-bedroom units. While the transactions are largely neutral to near-term FFO/unit, we expect incremental earnings growth beyond 2026 as fundamentals strengthen.
Flagship Communities REIT is a leading owner and operator in the manufactured housing sector, backed by a proven management team with a strong track record of creating shareholder value since its public listing in 2020. This company is another core position that was on the offensive this month announcing two acquisitions for a total of US$79 million, expanding its presence in the U.S. mid-west. Management expects the acquisitions to be immediately accretive to AFFO per share and comes with expansion opportunities. The REIT’s unit price is up over 20% year-to-date and it pays an attractive distribution of approximately 3.5% per annum.
Healthcare
Middlefield Fund Tickers & Codes: MHCD / MID 325 / SIH.UN
by Robert Moffat, Portfolio Manager
Healthcare has performed well since bottoming this summer. In October, the S&P 500 healthcare sector generated a total return of 3.6%, bringing its year-to-date return to 6.3%. Despite the recent bounce, healthcare still trades at a 5x P/E discount to the broader market which remains near historic levels. We maintain our call for a sustained re-rating in the sector over the coming months and see plenty of runway for continued outperformance.
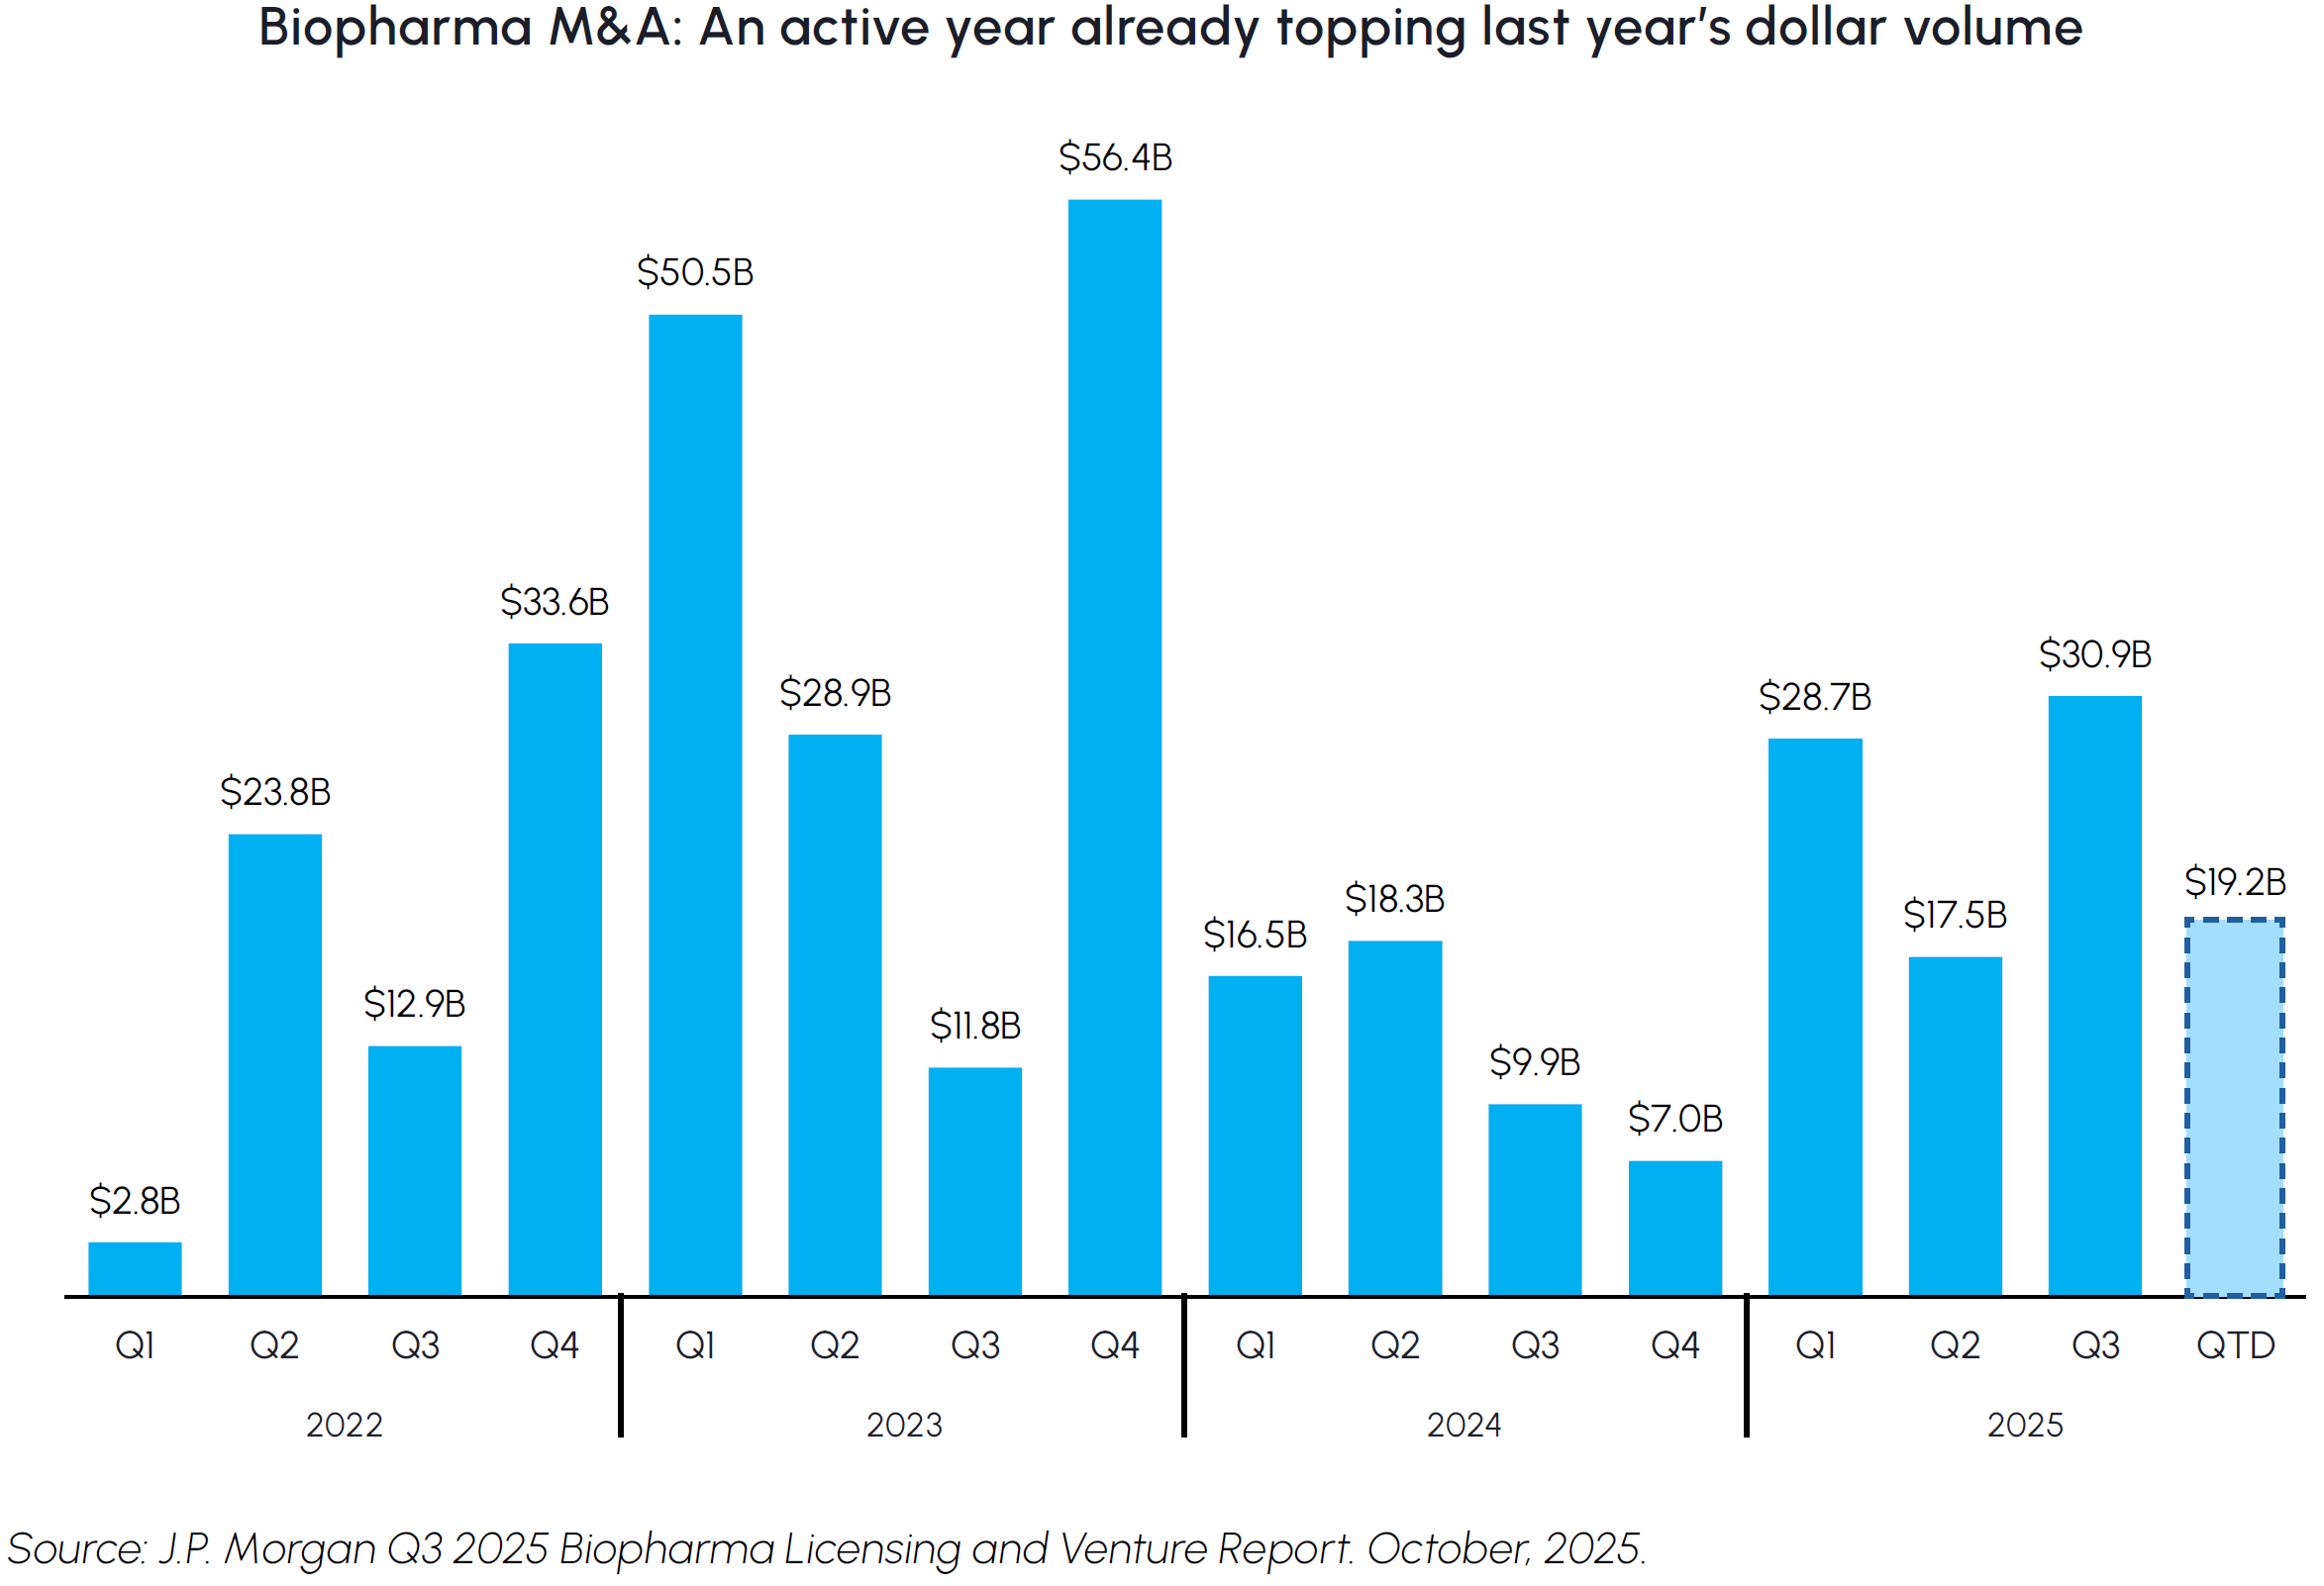
The biopharma industry has experienced a surge in M&A activity this year, signaling a renewed focus on innovation, pipeline expansion and revenue growth. Nearly US$100 billion of biopharma M&A has been announced year-to-date, doubling 2024’s full-year total. Noteworthy transactions include Johnson & Johnson’s $14.6 billion acquisition of Intra-Cellular Therapies, Novartis’ $12 billion purchase of Avidity Biosciences, Merck’s $10 billion acquisition of Verona Pharma, and Sanofi’s $9.5 acquisition of Blueprint Medicines. In a sign of how competitive the M&A environment has become, Pfizer’s initial $8 billion acquisition of Metsera, a player in the GLP-1 space, was topped by Novo Nordisk’s offer of up to $10 billion, sparking a bidding war between the two companies. Our Healthcare funds are positioned to benefit from this cycle of consolidation, with exposure on both sides of the ledger. We own established acquirers capable of integrating innovative assets through their global sales and manufacturing platforms, as well as a select group of emerging biotech companies that we believe represent compelling take-out candidates poised to attract meaningful acquisition premiums.
M&A momentum has extended beyond traditional biopharma as well, with Thermo Fisher Scientific (TMO) set to acquire data analytics provider Clario for US$9.4 billion. The deal aligns with TMO’s strategy to broaden its presence across the life sciences value chain, particularly in clinical trial technology and data management. In addition, TMO announced a collaboration with OpenAI to embed advanced AI tools across its operations — an initiative expected to shorten drug development timelines and enhance efficiency within its clinical research business. Together, these moves reinforce TMO’s position as a diversified leader driving innovation across healthcare tools and services.
Infrastructure
Middlefield Fund Tickers & Codes: MINF / MID 265 / MID 510 / ENS / IS / IS.PR.A
by Robert Lauzon, Managing Director & CIO
Canada’s 2025 Federal Budget outlines more than $115 billion in infrastructure spending over the next five years, marking one of the most significant multi-year capital programs in decades. The initiative aims to modernize core public infrastructure, expand trade-enabling corridors, and catalyze private investment across energy and industrial supply chains. A key priority is improving the efficiency of transporting Canada’s natural resources, reinforcing the importance of pipeline, export, and logistics capacity. This supports ongoing build-out activity such as Pembina’s Cedar LNG project and AltaGas’ West Coast LPG export expansions, advancing energy infrastructure and enhancing global market access.
Alberta’s independent power producers (IPPs) are seeing improved visibility on growth following the AESO’s Phase 2 interconnection allocation process, which introduces clearer pathways for large-scale load integration. CPX’s sale of its smaller 375 MW Phase 1 transmission capacity is consistent with its strategy to secure long-duration, large-load offtake agreements tied to data center development. CPX’s Genesee site remains central to this positioning, offering 400MW+ of excess capacity well-suited to hyperscale computing requirements. Provincial regulators are adopting a more constructive stance on attracting data center investment, while forward power prices beyond 2027 remain structurally elevated, supported by anticipated AI-driven load growth. The federal budget’s enhanced mandate for the Canadian Infrastructure Bank to support digital and power infrastructure further reinforces the role of Alberta’s IPPs as essential enables of Canada’s emerging data and compute ecosystem.
Technology & Communications
Middlefield Fund Tickers & Codes: MINN / SIH.UN / MID 925 / MDIV
by Shane Obata, Portfolio Manager
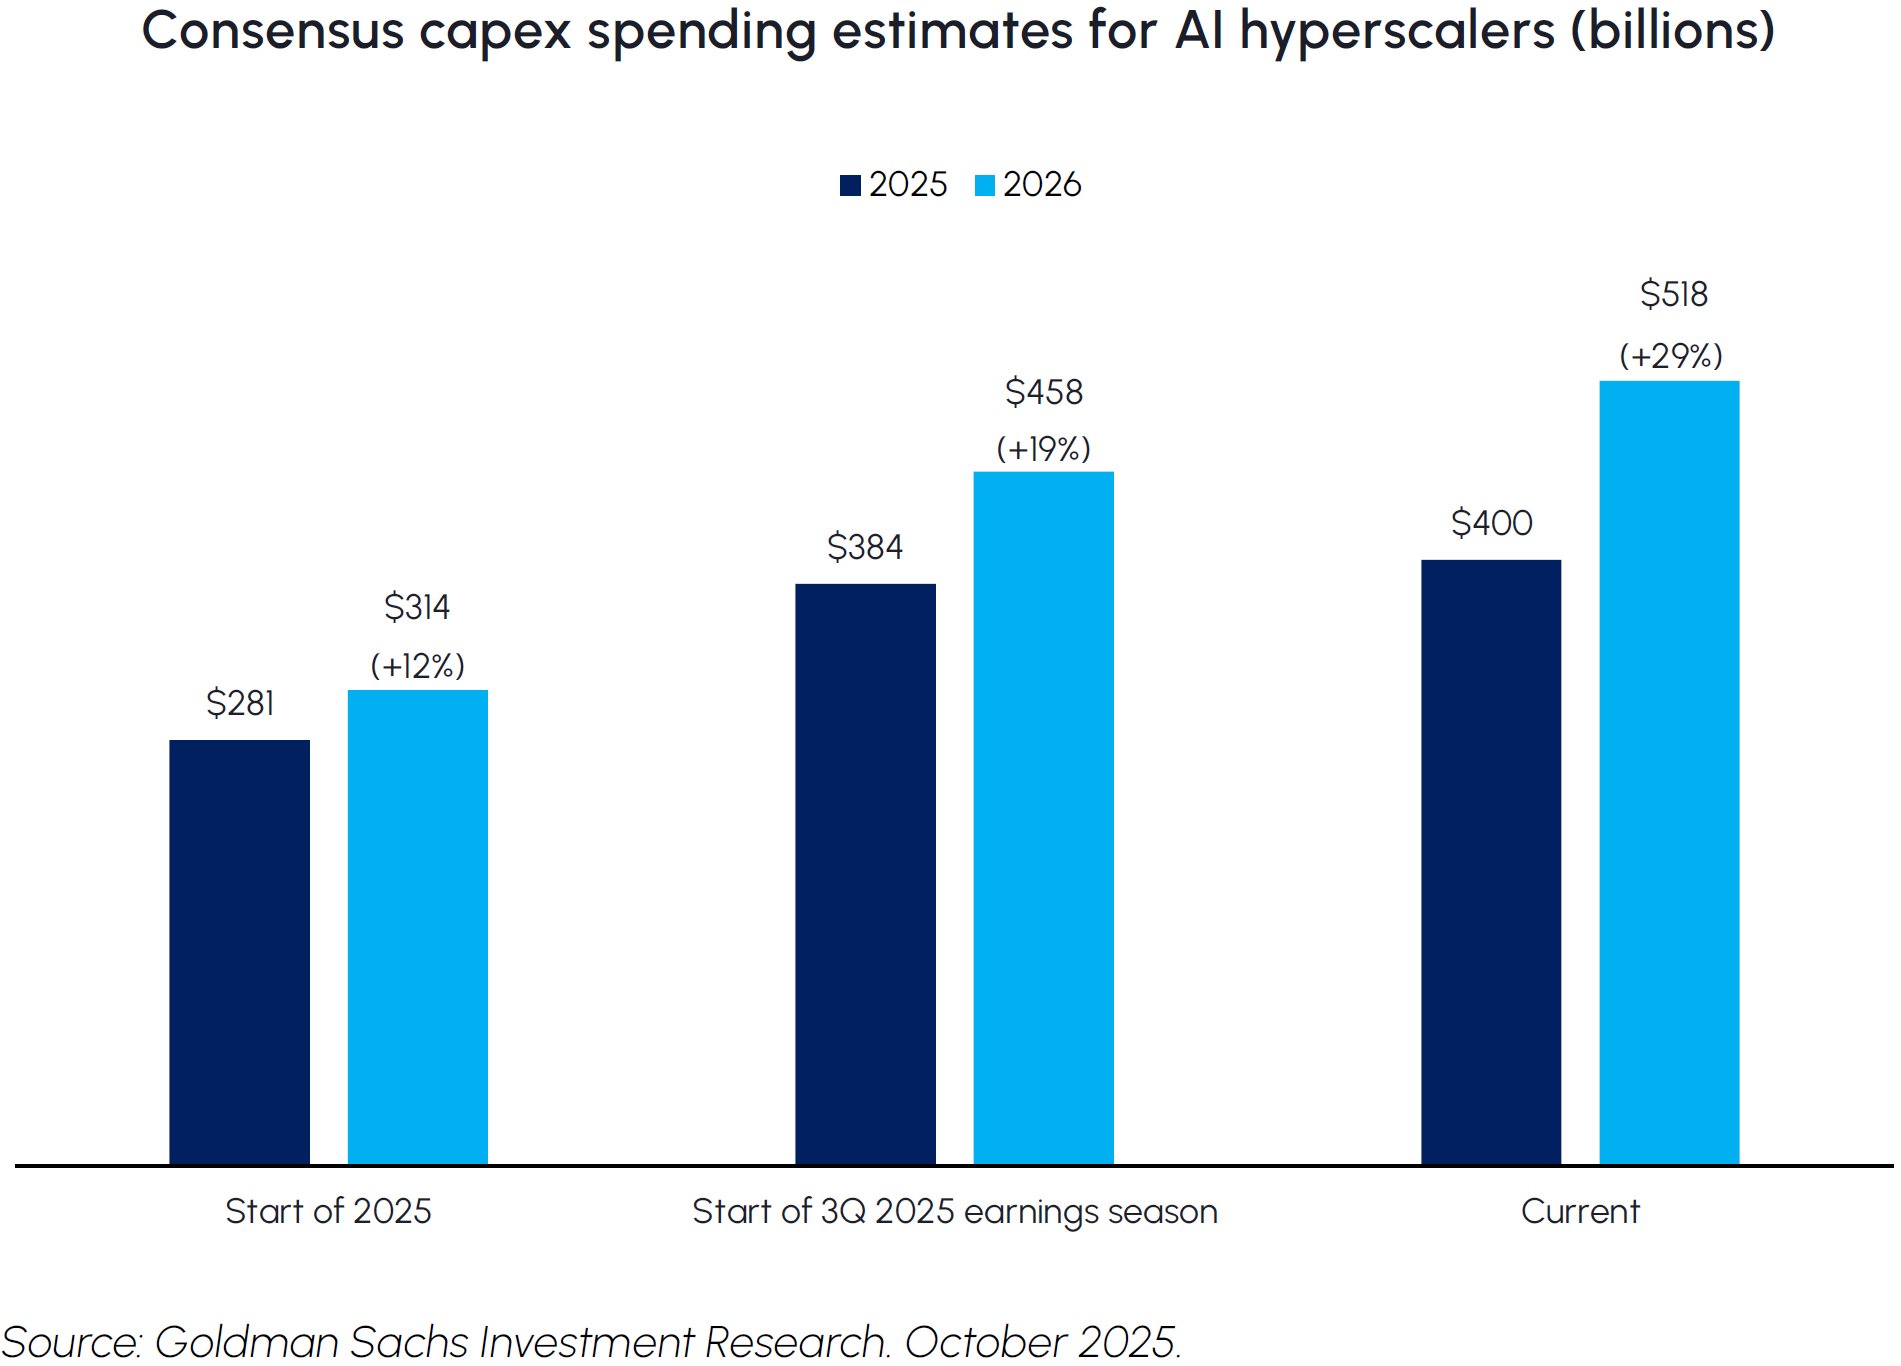
Hyperscaler capital expenditures continue to exceed expectations, reflecting the rapid acceleration of AI investment across the sector. Consensus estimates for 2026 hyperscaler capex have risen sharply over the course of the year — from US$314 billion at the start of 2025, to US$458 billion at the start of earnings season, and most recently to US$518 billion. This implies a 29% year-over-year increase, well above the 19% growth expected at the start of the reporting season. Leading AI hyperscalers including Amazon, Google, Meta, Microsoft and Oracle, are driving this spending surge, underscoring their commitment to expanding AI infrastructure and positioning themselves for continued dominance in cloud and generative AI applications.
The rapid buildout of AI infrastructure is causing major shortages in some of the necessary components. Many have likely heard of the supply crunch for the special, super-fast memory (called HBM) that the best AI chips require. Now, that shortage is spreading to the regular memory that all computers use. As companies start using AI for everyday tasks, they require fleets of new servers with powerful new computer brains (CPUs), and these new CPUs require a ton more standard memory to function, kicking off a massive upgrade cycle.
A similar supply crunch is happening in the world of data storage, because the AI tasks themselves are getting much bigger. For example, teaching an AI to write text might take 45 terabytes of data, but teaching it to create high-quality video can require hundreds of petabytes—that’s thousands of times more information. This data explosion means companies need to buy two different kinds of storage at once. For speed, they need fast Solid-State Drives (SSDs) to access data quickly while the AI is working. At the same time, for sheer capacity, they need massive traditional Hard Disk Drives (HDDs) to affordably store all that video and data.
Crucially, companies aren’t choosing one over the other; they are being forced to buy huge amounts of both. This is fantastic news for the companies that make memory and storage, as it gives them the power to charge more and signals a powerful, long-term investment opportunity across the entire sector.

Resources
Middlefield Fund Tickers & Codes: MID 800 / MID 161 / MID 265 / MRF FT LP / Discovery FT LP
by Dennis da Silva, Senior Portfolio Manager
Canada’s materials sector finally took a breather this month after an impressive run over the first nine months of the year. The TSX Global Gold Index declined 5.8% in October and experienced a nearly 20% pullback from its mid-October high. Even so, the Index has returned 106% year-to-date, marking one of the best years for the Canadian mining sector in decades.
Canada is spearheading efforts to establish a critical minerals alliance among G7 countries. The initiative aims to formalize a rules-based counterweight to China which will use long-term offtakes, price-support tools, and strategic stockpiles to de-risk new supply. The pact builds on June’s G7 Critical Minerals Action Plan and debuts with 26 Canada-linked investments and partnerships unlocking ~C$6.4B across graphite, rare earths, and scandium, alongside early offtake deals that signal procurement certainty for allied supply chains. This backdrop is a positive development for the Canadian mining sector. Procurement guarantees and stockpiling reduce funding risk and smooth cyclicality, improving earnings visibility for producers and developers alike. Strong balance sheets and rising free cash flow should support project expansions, while investors increasingly reward shovel-ready growth and mid-stream processing exposure. Within this framework, Canadian copper, nickel, lithium, and rare-earth companies are well positioned to capture incremental capital and policy-driven demand under the new alliance.
OPEC+ announced a modest 137 kb/d production increase for December while signaling a pause on additional hikes through early 2026, maintaining policy flexibility amid soft seasonal demand and ongoing geopolitical risk. The coordinated stance between Saudi Arabia and other major producers underscores near-term price stability and inflation control rather than market share expansion, aligning with U.S. political priorities ahead of 2026. With oil markets entering a holding pattern, attention is shifting toward natural gas, where fundamentals remain firm. Normal winter weather, incremental LNG demand, steady industrial activity, and rising power needs from data centers should keep prices supported. Core Canadian holdings such as CNQ and Tourmaline are positioned to benefit through disciplined capital allocation, strong balance sheets, and robust free cash flow generation.
Exchange Traded Funds (ETFs)
Mutual Funds (FE | F)
TSX-Listed Closed-End Funds
| Fund | Ticker | Strategy |
|---|---|---|
| MINT Income Fund | MID.UN | Equity Income |
| Sustainable Innovation & Health Dividend Fund | SIH.UN | Innovation & Healthcare |
TSX-Listed Split Share Corps. (Class A | Preferred)
| Fund | Ticker | Strategy |
|---|---|---|
| E-Split Corp. | ENS | ENS.PR.A | Energy Infrastructure |
| Real Estate Split Corp. | RS | RS.PR.A | Real Estate |
| Infrastructure Dividend Split Corp. | IS | IS.PR.A | Infrastructure |
LSE-Listed Fund
| Fund | Ticker | Strategy |
|---|---|---|
| Middlefield Canadian Enhanced Income UCITS ETF | LSE: MCTC | LSE: MCTP | Canadian Equity Income |
Commissions, trailing commissions, management fees and expenses all may be associated with mutual fund investments, including ETFs. Please read the prospectus before investing. You will usually pay brokerage fees to your dealer if you purchase or sell units/shares of investment funds on the Toronto Stock Exchange or other alternative Canadian trading system (an “Exchange”). If the units/shares are purchased or sold on an Exchange, investors may pay more than the current net asset value when buying and may receive less than the current net asset value when selling them. There are ongoing fees and expenses associated with owning units or shares of an investment fund. An investment fund must prepare disclosure documents that contain key information about the fund. You can find more detailed information about the fund in these documents. Mutual funds and investment funds are not guaranteed, their values change frequently and past performance may not be repeated. Certain statements in this disclosure are forward-looking. Forward-looking statements (“FLS”) are statements that are predictive in nature, depend upon or refer to future events or conditions, or that include words such as “may”, “will”, “should”, “could”, “expect”, “anticipate”, “intend”, “plan”, “believe”, or “estimate”, or other similar expressions. Statements that look forward in time or include anything other than historical information are subject to risks and uncertainties, and actual results, actions or events could differ materially from those set forth in the FLS. FLS are not guarantees of future performance and are by their nature based on numerous assumptions. Although the FLS contained herein are based upon what Middlefield Funds and the portfolio manager believe to be reasonable assumptions, neither Middlefield Funds nor the portfolio manager can assure that actual results will be consistent with these FLS. The reader is cautioned to consider the FLS carefully and not to place undue reliance on FLS. Unless required by applicable law, it is not undertaken, and specifically disclaimed that there is any intention or obligation to update or revise FLS, whether as a result of new information, future events or otherwise.
This material has been prepared for informational purposes only without regard to any particular user’s investment objectives or financial situation. This communication constitutes neither a recommendation to enter into a particular transaction nor a representation that any product described herein is suitable or appropriate for you. Investment decisions should be made with guidance from a qualified professional. The opinions contained in this report are solely those of Middlefield Limited (“ML”) and are subject to change without notice. ML makes every effort to ensure that the information has been derived from sources believed to reliable, but we cannot represent that they are complete or accurate. However, ML assumes no responsibility for any losses or damages, whether direct or indirect which arise from the use of this information. ML is under no obligation to update the information contained herein. This document is not to be construed as a solicitation, recommendation or offer to buy or sell any security, financial product or instrument.
The LSEG Lipper Fund Awards, granted annually, highlight funds and fund companies that have excelled in delivering consistently strong risk-adjusted performance relative to their peers. LSEG Lipper Fund Awards are based on the Lipper Leader for Consistent Return rating, which is a risk-adjusted performance measure calculated over 36, 60 and 120 months. The fund with the highest Lipper Leader for Consistent Return (Effective Return) value in each eligible classification wins the LSEG Lipper Fund Award. For greater detail on the LSEG Lipper Fund Awards and Lipper Leader Ratings, including the rating methodology, please visit lipperfundawards.com. Although LSEG makes reasonable efforts to ensure the accuracy and reliability of the data contained herein, their accuracy is not guaranteed by LSEG Lipper. The 2025 Awards were based on best risk-adjusted performance for the periods ended July 31, 2025. About Lipper Leader Ratings: The highest 20% of funds in each category are named LSEG Lipper Leaders for that particular rating and receive a score of 5, the next 20% receive a score of 4, the middle 20% are scored 3, the next 20% are scored 2 and the lowest 20% are scored 1. The Lipper Leader Ratings for each fund are subject to change every month. LSEG Lipper Fund Awards, ©2025 LSEG. All rights reserved. Used under license.
Performance for Funds: Middlefield Real Estate Dividend Class Series F was awarded the LSEG Lipper Fund Award in the Real Estate Equity category for the three and five-year periods ending July 31, 2025, out of a classification total of 15 and 14 funds, respectively. Performance for the Fund for the period ending July 31, 2025, is as follows: 8.6% (1 year), 4.8% (3 years), 5.9% (5 years), 5.8% (10 years) and 8.9% (since inception – September 30, 2011). The corresponding LSEG Lipper Leader ratings of the Fund as of July 31, 2025, are as follows: 5 (3 years), 5 (5 years) and 5 (10 years). Middlefield U.S. Equity Dividend Class Series F was awarded the LSEG Lipper Fund Award in the U.S. Dividend & Income Equity category for the three-year period ending July 31, 2025, out of a classification total of 20 funds. Performance for the Fund for the period ending July 31, 2025, is as follows: 10.8% (1 year), 18.5% (3 year), 13.4% (5 year), 9.9% (10 year) and 11.2% (since inception – June 17, 2014). The corresponding LSEG Lipper Leader ratings of the Fund as of July 31, 2025, are as follows: 5 (3 years), 2 (5 year) and 1 (10 year).


