

Index
Macro Update
by Dean Orrico, President & CEO and Robert Lauzon, CIO
Global equity markets declined in March as the war in Iran intensified, broadening macro pressures beyond energy prices into growth and earnings expectations. The TSX Composite (-4.3%) continued to outperform the S&P 500 (-5.0%) and the Nasdaq (-4.7%). Sector leadership remains concentrated within Energy and Utilities, as rising input costs continue to weigh on global markets. Equities had one of those months that felt a lot like the fits and starts Canada experiences as the green shoots of Spring attempt to emerge – just warm enough to hint that spring has arrived, yet cool enough to make you think twice before retiring your coat. Short rallies fueled by hopes of easing conflict quickly lost steam as Trump’s comments on Iran left energy risks unresolved, while tariffs and private credit concerns crept back into focus, leaving the market feeling unsettled.
Despite the turbulence, the market hasn’t lost its footing — sentiment has softened but not broken, and positioning remains cautious rather than outright defensive. The central question is whether this is a genuine seasonal turn or simply another head fake, with no clear answer yet in sight. For now, investors are selectively leaning in, but staying alert, unwilling to commit fully until the outlook becomes clearer. In contrast, Canada’s greater exposure to “real asset” sectors, combined with its leading reserve base and production capacity for critical minerals such as gold, potash, and uranium, all provide a relative buffer and remains an underappreciated driver of resilience.
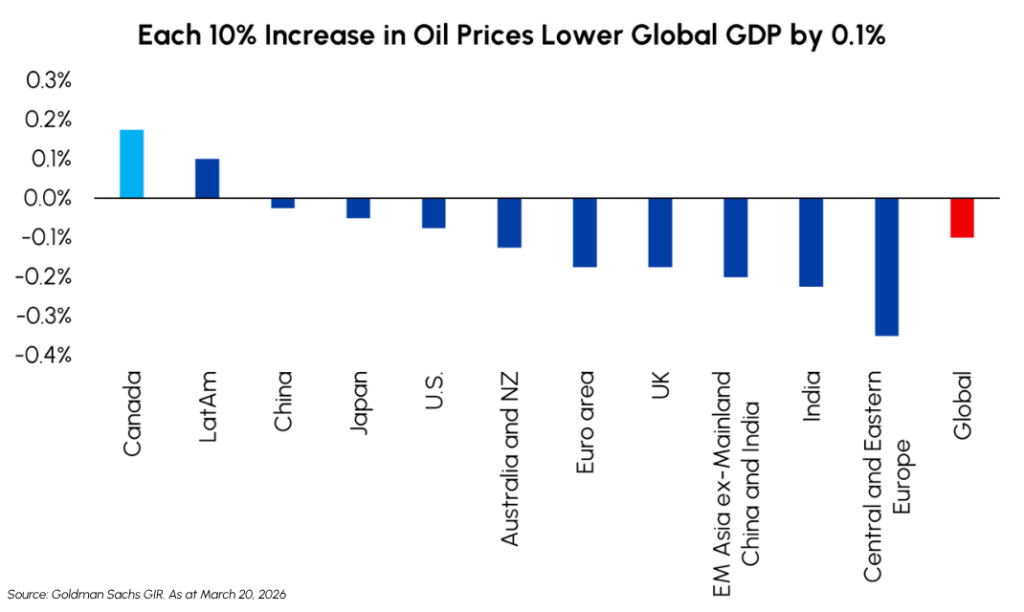
The joint U.S.-Israeli attack on Iran has resulted in the largest energy supply disruption in history, as shipping traffic in the Strait of Hormuz, through which 20% of global oil supplies typically flow, has significantly declined and regional energy infrastructure has become the latest target in the conflict. As a result, crude oil has surged more than 50% from ~$60 to above $100 per barrel, while global fuel prices moved higher across regions including Europe, Eastern Asia, and Australia. Rising input costs are beginning to weigh on global industrial activity, particularly across import-dependent regions in Europe and Asia that rely heavily on energy and critical inputs transiting through the Strait.
Looking ahead, early signs of de-escalation are beginning to emerge, with increasing indications that the Trump administration is exploring off-ramps as the U.S. approaches midterm elections. With U.S. gasoline prices above $4/gallon weighing on consumer sentiment and raising the risk of a growth slowdown, there is a clear incentive to contain further economic fallout. The duration of supply disruptions and the cumulative effect of higher energy costs on global growth and inflation will continue to weigh on the market outlook in the near term. Against this backdrop, Canada’s role as a reliable supplier of energy and critical resources continues to be an underappreciated aspect, and our Short Duration Bond Plus, ActivEnergy, and Income Plus strategies are ideally positioned to handle the ongoing market volatility.
Fixed Income
Middlefield Fund Tickers & Codes: MSBP / MID 435
by Gordon McKay, Senior Portfolio Manager
Fixed income markets were driven by the escalation in Iran, with rising oil and commodity prices pushing inflation expectations meaningfully higher across developed economies. Rate expectations adjusted quickly, with markets moving from pricing more than two cuts by the Federal Reserve (“Fed”) in 2026 to fewer than one, while expectations for the Bank of Canada (BoC) shifted from a neutral-to-easing stance toward the potential for one or two hikes. Government bond yields rose sharply and the curve flattened, with front-end yields increasing by ~40 basis points (bps) compared to ~25bps at the long end. By month-end, 10-year yields reached 4.30% in the U.S. and 3.46% in Canada, each approximately 30bps higher. At their mid-month meetings, both the BoC and Fed held policy rates unchanged. The BoC’s overnight rate remained at 2.25%, emphasizing downside risks to growth alongside persistent upside risks to inflation, while offering limited recognition of the potential income benefit from higher energy prices. Similarly, the Fed’s updated dot plot continued to signal a single cut in 2026, however the distribution shifted notably with an even split between expectations of no change or just one cut, and with fewer officials projecting an easing path.
Credit markets were comparatively resilient despite equity market volatility. Higher government yields made all-in corporate yields more attractive, so investors did not require as much additional spread as the equity sell-off would imply. U.S. investment grade (“IG”) spreads widened modestly by 4 bps to end the month at 90 bps, while High Yield (“HY”) spreads widened 16 bps to 328 bps. Weakness was more pronounced in lower-quality credit, with CCC-rated spreads backing up 42bps to 994bps, reflecting increased sensitivity to a more uncertain growth and inflation outlook.
Against this backdrop, the Fund used the rise in yields and modest spread widening to increase exposure and enhance diversification across issuers, with new positions added at attractive discounts or elevated yields, improving overall portfolio carry. The Fund’s conservative positioning limited the drawdown during a volatile month. The 2-year government bond position didn’t provide a risk-off hedge, as rates rose due to inflation concerns, but its negative duration mortgage-backed security exposure generated gains during the month. Portfolio duration ended the month at approximately 1.25 years with a currency adjusted yield near 3.5%.
The Fund remains focused on capital preservation and income generation through a short-duration, actively managed approach. With the flexibility to allocate across cash, government bonds, IG, and HY, as well as actively adjust duration between 0 and 2.5 years, the Fund is well positioned to navigate continued volatility. As of March 31, 2026, the yield to maturity stood at 3.62%, supporting a return profile targeting 100-200bps above cash while maintaining low volatility.
Real Estate
Middlefield Fund Tickers & Codes: MREL / MID 600 / RS / RS.PR.A
by Dean Orrico, President & CEO
Real estate demonstrated its defensive characteristics in March, outperforming broader equity markets despite a volatile macro backdrop and rising interest rates. Middlefield’s real estate funds (MREL and MID601) generated year-to-date returns of 2.0% and 1.7%, respectively, compared to a -6.7% decline for the S&P 500. This outperformance has come despite the U.S. 10-year yield rising from 4.18% in early January to as high as 4.48% in March, reinforcing the resilience of the structural cash flows from real assets.
Strength remains most evident in the seniors housing and industrial sectors, where supply-demand fundamentals continue to be highly supportive. Seniors housing, in particular, is benefiting from structurally constrained supply and accelerating demand, dynamics that have kept us overweight the segment through positions in Welltower, Extendicare, and Chartwell, all of which are delivering strong occupancy gains and operating leverage. At the same time, industrial markets have largely absorbed the excess supply that weighed on fundamentals in prior years, with leasing spreads remaining robust and rents stabilizing at attractive levels. We continue to favor high-quality industrial platforms such as Granite, Prologis, and Dream Industrial, which are well positioned to capture embedded rental growth as market conditions firm.
In contrast, multi-family and retail remain overlooked segments despite compelling valuations. Multi-family REITs are currently trading at some of the widest discounts to NAV in years, reflecting near-term pressure from elevated supply and softer rental conditions in select markets. However, we view these headwinds as cyclical, with attractive long-term demand drivers and increasing evidence of private market interest through recent takeout activity. Retail also continues to surprise to the upside, supported by limited new supply, stable occupancy in the mid-90% range, and consistent rent growth driven by high-quality tenant bases. We are constructive on both sectors, where current valuations do not fully reflect the strength and durability of underlying cash flows.
Healthcare
Middlefield Fund Tickers & Codes: MHCD / MID 325 / SIH.UN
by Dean Orrico, President & CEO
The S&P 500 Healthcare sector declined -8.1% in March, reflecting a market dynamic driven more by an inflation growth shock than the sector’s historical risk adverse haven characteristics. This pattern is consistent with prior commodity-driven shocks, where defensiveness alone has not been sufficient to support relative performance.
MedTech was among the most affected sub-sectors, with the group down -14.7% year-to-date. While positioning and multiple compression have weighed on performance, underlying fundamentals remain intact. Procedure volumes continue to track well, guidance has remained stable, and demand hasn’t shown any signs of pull-forward or deferral. More importantly, the sub-industry is supported by durable, multi-year tailwinds, including aging demographics and significant under penetration across key therapeutic areas. Adoption of robotic-assisted surgery remains in the early innings, while conditions such as cardia arrhythmia remain materially underdiagnosed. We maintain exposure to these trends through holdings such as Intuitive Surgical and Medtronic and view the recent pullback as an opportunity to add to high-quality franchises rather than a signal of deteriorating fundamentals.
We remain underweight Managed Care, where the operating backdrop continues to be more challenged. Elevated medical cost trends, ongoing pressure in Medicare Advantage, and softer dynamics in ACA Exchange enrollment have weighed on earnings visibility and margin recovery. Notwithstanding the headwinds the sub-sector has faced over the last few years the recent proposal for the 2027 final Medicare rate payment increase of 2.48% was higher than expectations alleviating pressure on the sector short-term. We believe a more compelling entry point will emerge as these pressures are more fully reflected in valuations and earnings visibility becomes less opaque.
Encouragingly, capital deployment across biopharma remains active, with large-cap companies pursuing acquisitions to address upcoming patent expiration, supporting both our large-cap pharmaceutical exposure as well as select biotechnology holdings positioned as potential acquisition targets. The integration of artificial intelligence is beginning to reshape the industry’s long-term economics, with partnerships such as that between Eli Lilly and Insilico Medicine highlight how AI can enhance drug development by lowering costs, expand the pipeline of viable candidates, and potentially improve success rates in later-stage trials. We view this as a structural tailwind for innovation-driven biopharma and the broader healthcare ecosystem.
Infrastructure
Middlefield Fund Tickers & Codes: MINF / MID 265 / MID 510 / ENS / IS / IS.PR.A
Canada’s energy infrastructure is increasingly emerging as a key beneficiary of the ongoing disruption across global commodity markets. As conflict in the Middle East constrains flows through the Strait of Hormuz, energy-importing regions such as Europe and Asia are accelerating efforts to diversify supply toward politically stable, resource-rich partners. Canada stands out in this regard as a net exporter of oil, natural gas, and critical minerals supported by large, long-life reserves and a relatively insulated domestic supply chain. Recent policy direction under Prime Minister Mark Carney has reinforced this shift, with bilateral agreements focused on expanding trade beyond the United States and toward key Asian and European markets. This evolution highlights the strategic value of Canada’s land-based infrastructure network, particularly its pipeline systems and West Coast export terminals, which provide direct access to end markets such as Japan and South Korea.
LNG Canada Phase 2 is expected to reach final investment decision (FID) by mid-2026 and aims to double total capacity to 28 million tons per annum, materially expanding Canada’s ability to serve incremental LNG demand from Asia and Europe amid ongoing global supply disruptions. A key project partner, TC Energy, has also formalized agreements to advance Phase 2 of the Coastal GasLink pipeline, with capacity expected to increase to ~5 bcf/d to support higher export volumes from Kitimat. These recent developments will serve as a broader catalyst for the Canadian energy complex, improving long-term growth visibility for pipeline operators through a combination of rising export capacity and structurally tight global LNG markets.
AltaGas’ export platforms, including its developing Ridley Energy Export Facility (REEF), provide critical connectivity between Western Canadian production and global end markets. REEF represents a meaningful expansion in AltaGas’ ability to handle a broader mix of liquids and gases, supporting greater throughput and diversification across its earnings base. As global buyers seek long-term contracts with stable jurisdictions, AltaGas’ integrated midstream and export model enables it to capture both volume growth and improving pricing dynamics, reinforcing its role as a key enabler of Canada’s evolving energy export strategy. These assets are gaining strategic importance in an environment where reliability of supply commands a premium and incremental export capacity remains limited globally. We continue to own meaningful exposure to AltaGas and Canadian pipeline operators through our Global Infrastructure funds as well as Income Plus strategies.
Technology & Communications
Middlefield Fund Tickers & Codes: MINN / SIH.UN / MID 925 / MDIV
by Shane Obata, Portfolio Manager
Technology stocks have faced a challenging start to 2026, noticeably underperforming the broader market. This sluggishness stems from a confluence of various headwinds that have weighed heavily on investor sentiment. First, the crowded “Magnificent Seven” trade has lost its momentum, acting as a heavy drag on indexes due to high scrutiny around their business models becoming more capital intensive. Second, a shifting competitive dynamic at the foundational AI layer – highlighted by growing market anxieties that OpenAI may be ceding its undisputed leadership position to Anthropic – has injected fresh uncertainty into the AI narrative. Finally, broad apprehension continues to swirl around traditional software companies as investors grapple with how rapidly generative AI might disrupt established application businesses.
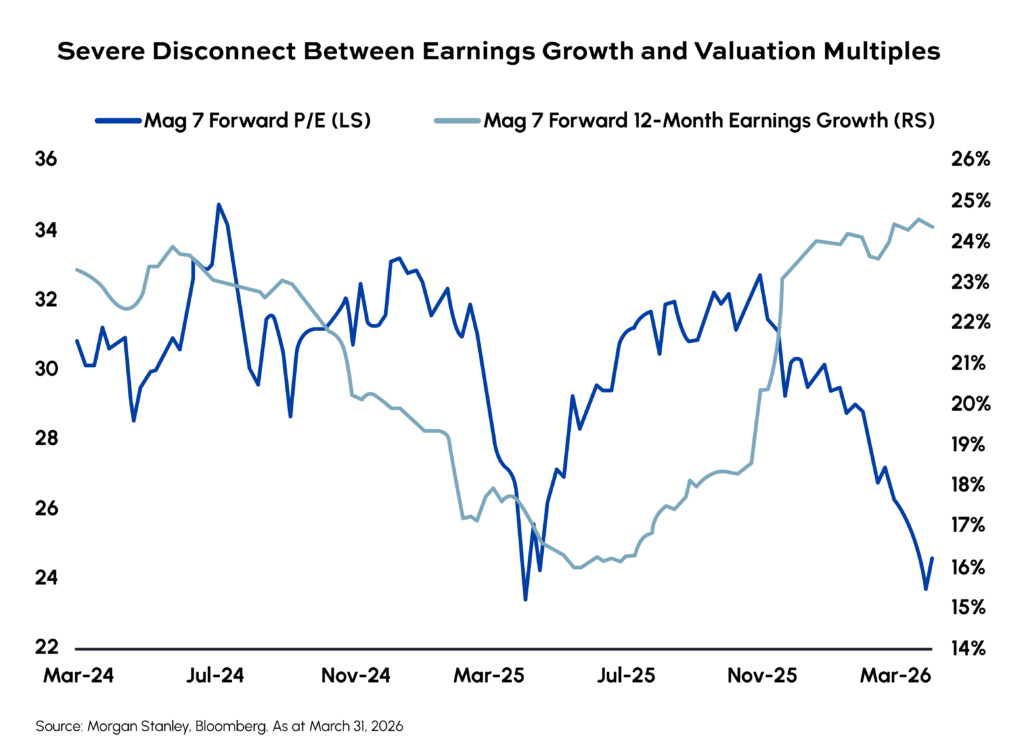
Despite this turbulent surface-level backdrop, we strongly believe investors need to maintain—and seriously consider increasing—their allocations to the Technology sector. Looking past the headline noise reveals a stark fundamental reality: Technology continues to deliver the best earnings growth in the entire market, and it is doing so by a remarkably wide margin and with continued positive revisions. Furthermore, the recent price corrections have fundamentally de-risked the sector. Valuations have compressed to levels that are no longer just attractive to growth buyers; they are now actively drawing the attention of traditional value investors who recognize the severe disconnect between current multiples and future cash flow generation potential.
This environment of high dispersion is precisely where active management thrives. Year-to-date, our MINN ETF has successfully navigated this turbulence, posting a gain of more than 6% through April 2nd and significantly outperforming the Nasdaq Composite, which is down more than 4% over the same period. This substantial alpha generation is the direct result of our deliberate portfolio construction. Our returns were driven by a strategic underweighting of both the lagging Magnificent Seven and the vulnerable software space, protecting our capital from the sector’s heaviest anchors. Conversely, we successfully directed capital toward the tangible, physical beneficiaries of the AI buildout, with our preferred allocations across the Memory & Storage industries acting as a primary engine of our outperformance.
As the year unfolds, our strategy remains resolute. We continue to look past the volatile sentiment swings at the software and model layers. Instead, we are focusing our capital on the indispensable industry leaders across their respective domains that are currently generating outsized, quantifiable earnings from the global AI buildout. By owning the companies with the most durable prospects for continued earnings growth, we believe the portfolio is ideally positioned for the remainder of the year.
Resources
Middlefield Fund Tickers & Codes: MID 800 / MID 161 / MID 265 / MRF FT LP / Discovery FT LP
by Dennis da Silva, Senior Portfolio Manager
March was a paradoxical month: geopolitical conflict intensified, yet gold suffered its steepest monthly decline since 2008. Gold equities, despite excellent fundamentals and record margins, were swept up in the selling underperforming broad North American markets in March for the first time since October, with bullion down 11.5% while the S&P/TSX Gold Index declined 17.6%. A combination of factors including a stronger dollar, a hawkish shift in Fed expectations, and unwinding of momentum positions following the initial ‘war rally’ overpowered safe‑haven flows. The deeper narrative is that the correction was driven by liquidity and positioning including news that Turkey’s central bank engaged in selling gold following the outbreak of the Iran conflict to provide immediate liquidity to defend the Turkish Lira, not a collapse in gold’s long‑term story. Companies are generating record margins, balance sheets are strong and capital allocation is notably more disciplined than in past cycles. We expect positive equity reaction to upcoming Q1 earnings in the sector.
During March, the global energy landscape was defined by volatility and regional fragmentation under geopolitical stress. Oil markets were thrown into turmoil, with supply collapsing and prices spiking amid the worst Middle East disruption on record. According to the IEA, the war in the Middle East triggered the largest supply disruption in oil market history. Crude and refined product flows through the Strait of Hormuz collapsed from approximately 20 mmbbls/d to a trickle, forcing Gulf producers to shut in production with only partial offsets from non‑OPEC+ producers and re-routing through pipelines. In response, IEA member countries agreed to release 400 million barrels from emergency reserves, unfortunately with little practical impact on stabilizing markets. Meanwhile, natural gas markets remain fractured, with Europe and Asia experiencing panic‑level price spikes while the U.S. remained buffered by strong domestic fundamentals. Iranian missile strikes damaged Ras Laffan in Qatar, the world’s largest LNG hub (20% of global supply), leading to European and Asian prices surging 32% and 25% in a single day. Despite global chaos, U.S. gas prices barely budged, supported by above‑average storage, record domestic production, and strong but steady LNG feed gas demand. Middlefield ActivEnergy Dividend Class has capitalized on the resulting demand for energy equities with YTD performance of +33.0%.
Exchange Traded Funds (ETFs)
Mutual Funds (FE | F)
TSX-Listed Closed-End Funds
| Fund | Ticker | Strategy |
|---|---|---|
| MINT Income Fund | MID.UN | Equity Income |
| Sustainable Innovation & Health Dividend Fund | SIH.UN | Innovation & Healthcare |
TSX-Listed Split Share Corps. (Class A | Preferred)
| Fund | Ticker | Strategy |
|---|---|---|
| E-Split Corp. | ENS | ENS.PR.A | Energy Infrastructure |
| Real Estate Split Corp. | RS | RS.PR.A | Real Estate |
| Infrastructure Dividend Split Corp. | IS | IS.PR.A | Infrastructure |
LSE-Listed Fund
| Fund | Ticker | Strategy |
|---|---|---|
| Middlefield Canadian Enhanced Income UCITS ETF | LSE: MCTC | LSE: MCTP | Canadian Equity Income |
Commissions, trailing commissions, management fees and expenses all may be associated with mutual fund investments, including ETFs. Please read the prospectus before investing. You will usually pay brokerage fees to your dealer if you purchase or sell units/shares of investment funds on the Toronto Stock Exchange or other alternative Canadian trading system (an “Exchange”). If the units/shares are purchased or sold on an Exchange, investors may pay more than the current net asset value when buying and may receive less than the current net asset value when selling them. There are ongoing fees and expenses associated with owning units or shares of an investment fund. An investment fund must prepare disclosure documents that contain key information about the fund. You can find more detailed information about the fund in these documents. Mutual funds and investment funds are not guaranteed, their values change frequently and past performance may not be repeated. Certain statements in this disclosure are forward-looking. Forward-looking statements (“FLS”) are statements that are predictive in nature, depend upon or refer to future events or conditions, or that include words such as “may”, “will”, “should”, “could”, “expect”, “anticipate”, “intend”, “plan”, “believe”, or “estimate”, or other similar expressions. Statements that look forward in time or include anything other than historical information are subject to risks and uncertainties, and actual results, actions or events could differ materially from those set forth in the FLS. FLS are not guarantees of future performance and are by their nature based on numerous assumptions. Although the FLS contained herein are based upon what Middlefield Funds and the portfolio manager believe to be reasonable assumptions, neither Middlefield Funds nor the portfolio manager can assure that actual results will be consistent with these FLS. The reader is cautioned to consider the FLS carefully and not to place undue reliance on FLS. Unless required by applicable law, it is not undertaken, and specifically disclaimed that there is any intention or obligation to update or revise FLS, whether as a result of new information, future events or otherwise.
This material has been prepared for informational purposes only without regard to any particular user’s investment objectives or financial situation. This communication constitutes neither a recommendation to enter into a particular transaction nor a representation that any product described herein is suitable or appropriate for you. Investment decisions should be made with guidance from a qualified professional. The opinions contained in this report are solely those of Middlefield Limited (“ML”) and are subject to change without notice. ML makes every effort to ensure that the information has been derived from sources believed to reliable, but we cannot represent that they are complete or accurate. However, ML assumes no responsibility for any losses or damages, whether direct or indirect which arise from the use of this information. ML is under no obligation to update the information contained herein. This document is not to be construed as a solicitation, recommendation or offer to buy or sell any security, financial product or instrument.


